Fig. 5
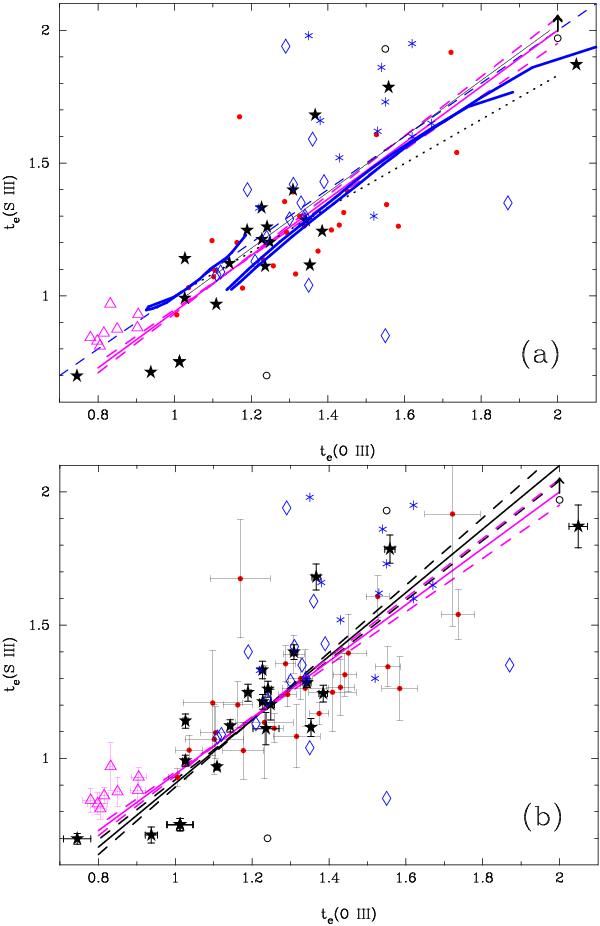
Comparison of electron temperatures te(O iii) (te = 10-4 Te) obtained from [O iii]λ4363/(λ4959 + λ5007) and te(S iii) obtained from [S iii]λ6312/λ9069 emission-line ratios. VLT/UVES data are shown by stars, except for three objects with uncertain values, which are shown as open circles (see Sect. 3.1). Twenty-seven data points from SDSS DR3 (see text) are shown by red dots. Open blue diamonds, blue asterisks, and purple triangles correspond to data from Kehrig et al. (2006), Pérez-Montero & Diaz (2003) and García-Rojas & Esteban (2007), respectively. The dashed blue line in the upper panel connects locations of equal temperature. The thick blue lines (also in the upper panel) are the predicted te(S iii) – te(O iii) relations for H ii region models from Izotov et al. (2006). The dotted and thin solid black lines are the curves from Garnett (1992) and Pérez-Montero & Diaz (2005), respectively. Regression lines (solid lines) and 1σ alternatives (dashed lines) for all our data plus data from García-Rojas & Esteban (2007) are shown by purple lines. In the lower panel the error bars are shown for the VLT, SDSS, and García-Rojas & Esteban (2007) data. Additionally, regression lines for VLT+SDSS-only data are shown by black lines. (A color version of this figure is available in the online journal.)
Current usage metrics show cumulative count of Article Views (full-text article views including HTML views, PDF and ePub downloads, according to the available data) and Abstracts Views on Vision4Press platform.
Data correspond to usage on the plateform after 2015. The current usage metrics is available 48-96 hours after online publication and is updated daily on week days.
Initial download of the metrics may take a while.