Fig. 14
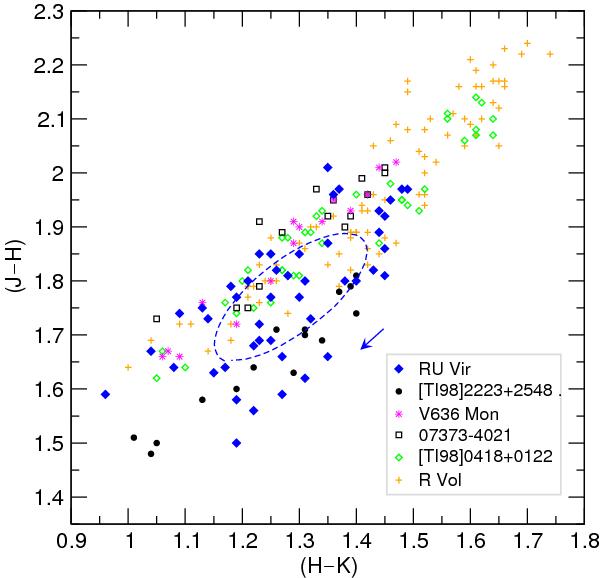
Colour − colour diagram containing observations at several epochs for a sample of C-type Miras adopted from Whitelock et al. (2006) as listed in their Table 2 (no correction for interstellar reddening). In addition, the dashed line marks the average variation of RU Vir during the light cycle as derived from the sinusoidal fits in Fig. 8. The arrow marks the direction of how the star passes through the loop.
Current usage metrics show cumulative count of Article Views (full-text article views including HTML views, PDF and ePub downloads, according to the available data) and Abstracts Views on Vision4Press platform.
Data correspond to usage on the plateform after 2015. The current usage metrics is available 48-96 hours after online publication and is updated daily on week days.
Initial download of the metrics may take a while.