Fig. 3
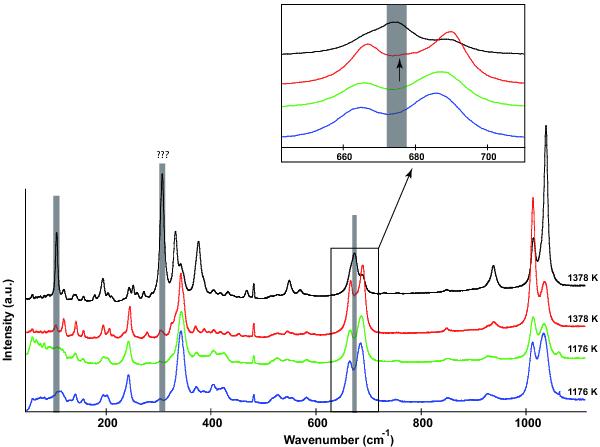
Typical Raman spectra of samples annealed at 1176 K and 1378 K. The latter temperature is in the stability field of protoenstatite, which is easily quenched for small samples such as dust analogues. For each sample, several spectra were recorded to check the reproducibility of the signature and to make sure that it does not depend on crystal orientation. Here, two characteristic spectra are reproduced for each temperature. The two main regions that significantly differ from other polymorphs are indicated in grey (105 cm-1 and 673 cm-1). Note that peak intensities are not considered because they depend on the orientation of the analysed crystals. Yet a third region of interest is indicated in grey (307 cm-1). It may correspond to a band that has a strong intensity in protoenstatite and weak intensities in other polymorphs. The inset shows that the symmetric Si-O-Si bending doublet at 663−685 cm-1 in clinoenstatite and orthoenstatite is reduced to a single peak at 673 cm-1 in protoenstatite as detailed in Reynard et al. (2008).
Current usage metrics show cumulative count of Article Views (full-text article views including HTML views, PDF and ePub downloads, according to the available data) and Abstracts Views on Vision4Press platform.
Data correspond to usage on the plateform after 2015. The current usage metrics is available 48-96 hours after online publication and is updated daily on week days.
Initial download of the metrics may take a while.