Fig. 9
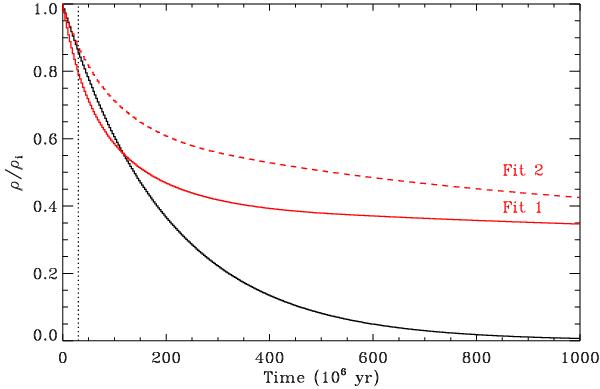
Evolution of the C-H aliphatic component of the interstellar matter under cosmic ray irradiation. The values of σd were determined from a-C:H 1 data with α = 1.0 (see Fig. 5). The black curve corresponds to an exponential decrease without residual hydrogen content taking into account (ρ/ρi = exp(−Rd,CR·t)). The red solid (fit 1) and dashed (fit 2) curves are obtained when the asymptotic values ρf/ρi ≠ 0 are considered. Values of ρf/ρi are determined from a-C:H 1 data and two different fits (see Fig. 6 and text for details). The dotted vertical line corresponds to a typical cloud time scale t = 3 × 10⁷ yr. (McKee 1989; Draine 1990; Jones et al. 1994).
Current usage metrics show cumulative count of Article Views (full-text article views including HTML views, PDF and ePub downloads, according to the available data) and Abstracts Views on Vision4Press platform.
Data correspond to usage on the plateform after 2015. The current usage metrics is available 48-96 hours after online publication and is updated daily on week days.
Initial download of the metrics may take a while.