Fig. 2
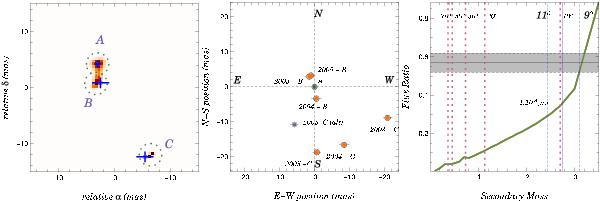
Left: reconstructed image of the 2004 epoch using the MIRA software. Three components are resolved (encircled dots) and identified according to their brightness (A, B and C respectively from brightest to dimmest in H). Blue crosses indicate the positions as obtained from model fitting. Centre: presentation of the data from Table 2. Square point represents the alternative position for epoch 2005. Right: predicted H-band flux ratio as a function of the secondary mass with a primary mass of 3.6 M⊙. Shaded region is the flux-ratio constraint from our observations (epoch 2004). Vertical dashed lines provide the system inclination. Vertical blue lines are the secondary mass estimate corresponding to distance d ≈ 414 ± 7 pc.
Current usage metrics show cumulative count of Article Views (full-text article views including HTML views, PDF and ePub downloads, according to the available data) and Abstracts Views on Vision4Press platform.
Data correspond to usage on the plateform after 2015. The current usage metrics is available 48-96 hours after online publication and is updated daily on week days.
Initial download of the metrics may take a while.