Fig. 8
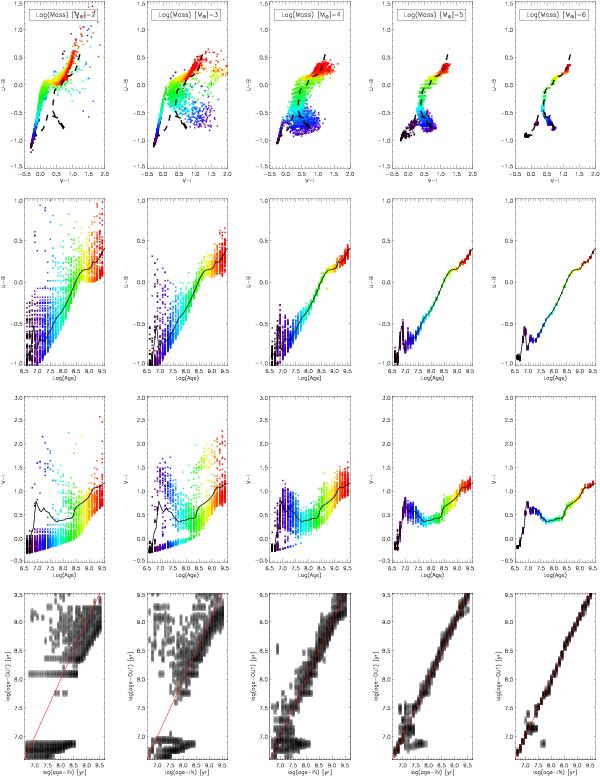
Stochastic effects on colors and ages of clusters. First row: two color diagrams for a stochastic sample of clusters with different masses and different ages. The dashed line represents Padova 2008 SSP models of solar-like metallicity. Second row: U − B color evolution. Third row: V − I color evolution. Fourth row: density plot to make a comparison between input and output ages. The red line represents the 1:1 relation, not a fit to the data.
Current usage metrics show cumulative count of Article Views (full-text article views including HTML views, PDF and ePub downloads, according to the available data) and Abstracts Views on Vision4Press platform.
Data correspond to usage on the plateform after 2015. The current usage metrics is available 48-96 hours after online publication and is updated daily on week days.
Initial download of the metrics may take a while.