Free Access
Fig. 2
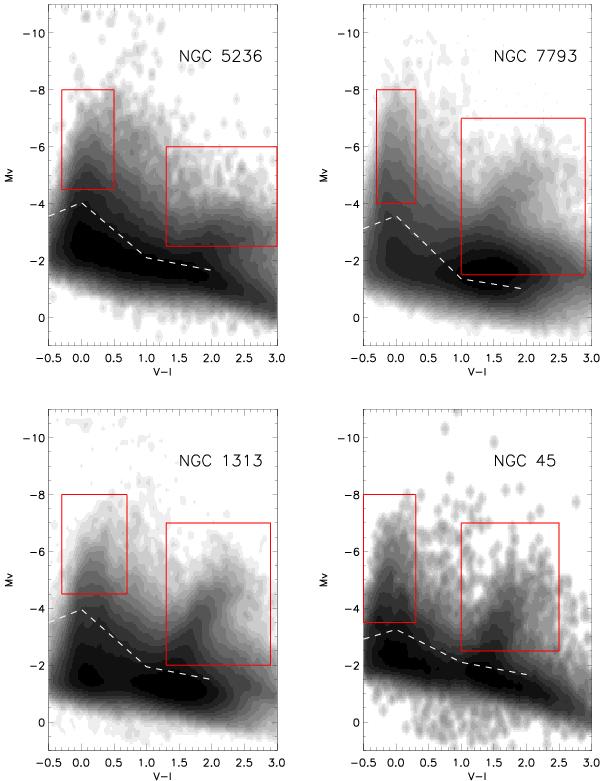
Hess diagram for the field stars of the observed galaxies. The dashed white line represents the 50% completeness curve. Red lines enclose the fitted areas used to estimate the SFH (see Sect. 5).
Current usage metrics show cumulative count of Article Views (full-text article views including HTML views, PDF and ePub downloads, according to the available data) and Abstracts Views on Vision4Press platform.
Data correspond to usage on the plateform after 2015. The current usage metrics is available 48-96 hours after online publication and is updated daily on week days.
Initial download of the metrics may take a while.