Free Access
Fig. 16
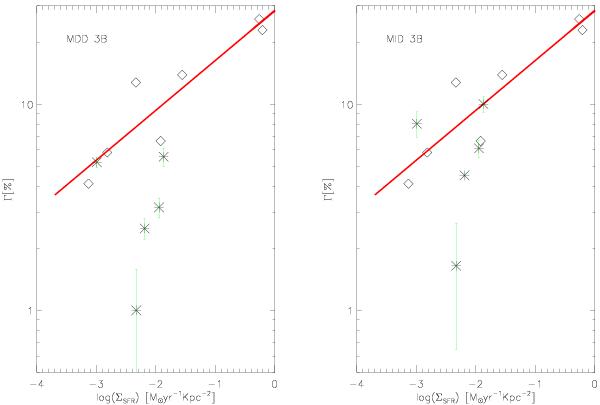
Relation between Γ and ΣSFR using average values of Γ for the models MDD and MID. Rhombs symbols and line represents the Goddard et al. (2010) data and black star symbols represent our set of galaxies.
Current usage metrics show cumulative count of Article Views (full-text article views including HTML views, PDF and ePub downloads, according to the available data) and Abstracts Views on Vision4Press platform.
Data correspond to usage on the plateform after 2015. The current usage metrics is available 48-96 hours after online publication and is updated daily on week days.
Initial download of the metrics may take a while.