Fig. 15
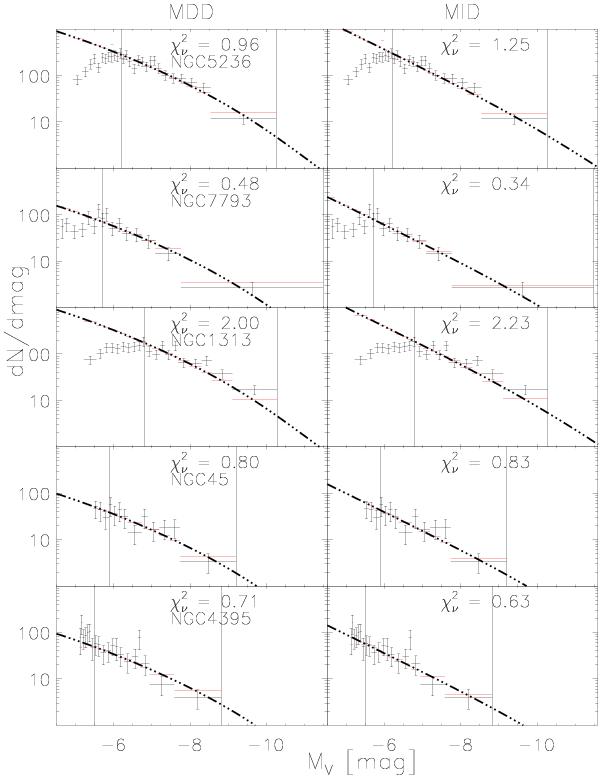
LFs for the five galaxies in our sample. We used MDD and MID theoretical models in left and right columns, respectively. Vertical lines are the limits of the fit. Red horizontal lines represent the binned theoretical values, while black horizontal lines represent observations. Errors are Poissoninan. Dashed-dotted line is the theoretical LF not binned.
Current usage metrics show cumulative count of Article Views (full-text article views including HTML views, PDF and ePub downloads, according to the available data) and Abstracts Views on Vision4Press platform.
Data correspond to usage on the plateform after 2015. The current usage metrics is available 48-96 hours after online publication and is updated daily on week days.
Initial download of the metrics may take a while.