Fig. 13
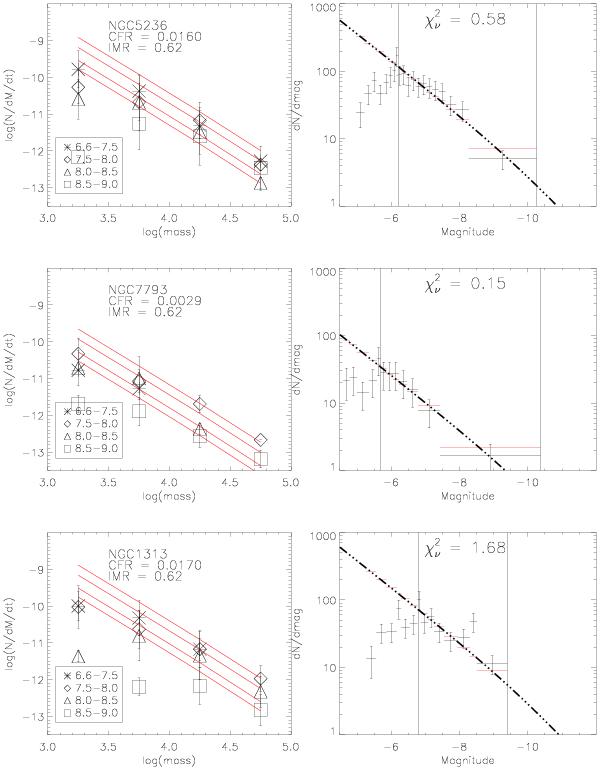
Mass-independent models. Left column: MDs observed (black symbols) and predicted models (red lines). Right column: luminosity function observed (black horizontal lines), predicted models (red horizontal lines), and theoretical model (dash-dotted line). Vertical straight lines represent the limits used for the fit of the LFs.
Current usage metrics show cumulative count of Article Views (full-text article views including HTML views, PDF and ePub downloads, according to the available data) and Abstracts Views on Vision4Press platform.
Data correspond to usage on the plateform after 2015. The current usage metrics is available 48-96 hours after online publication and is updated daily on week days.
Initial download of the metrics may take a while.