Fig. 12
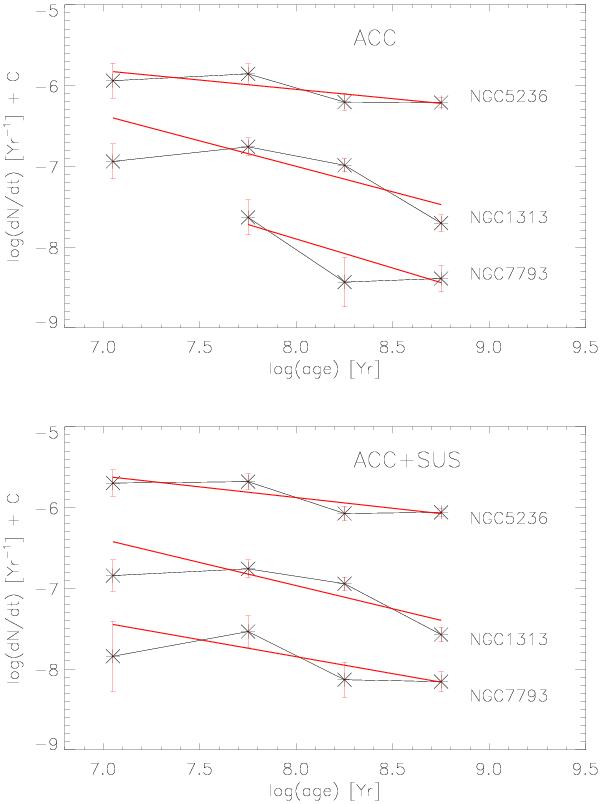
Age distributions for clusters in the galaxies NGC 5236, NGC 7793, and NGC 1313 in the mass range 104 to 105 M⊙. Black lines represent the distributions for galaxies. Red lines represent the best fit. Upper panel are the ADs only using the clusters classified as accepted. The lower panel are the ADs for the clusters classified as accepted plus suspected.
Current usage metrics show cumulative count of Article Views (full-text article views including HTML views, PDF and ePub downloads, according to the available data) and Abstracts Views on Vision4Press platform.
Data correspond to usage on the plateform after 2015. The current usage metrics is available 48-96 hours after online publication and is updated daily on week days.
Initial download of the metrics may take a while.