Fig. 11
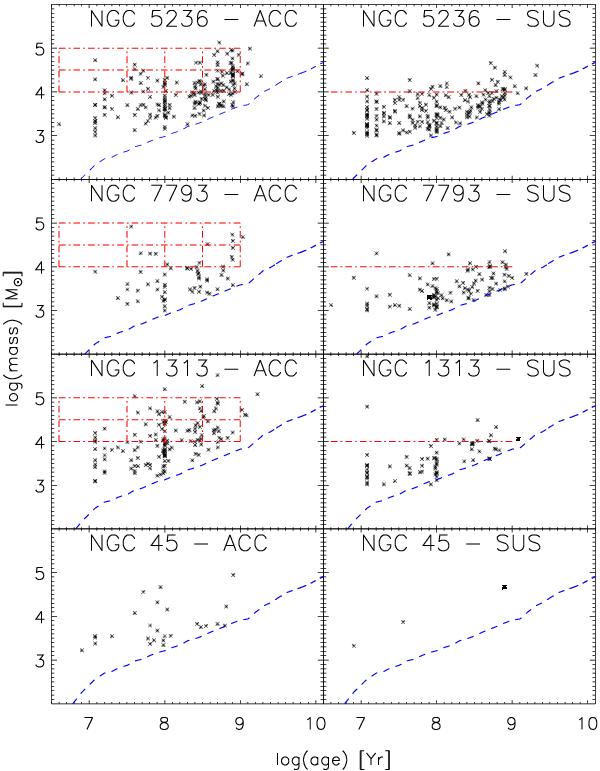
Age-mass distributions for the cluster systems. Blue dashed lines represent the magnitude cut at mv = 23. Red boxes will be used to create the age and mass distributions. Left column present the distribution for the Accepted sample, while the right column present the suspected sample of clusters (see Sect. 4.2). Red dash-dotted line in the right column denotes the mass 104 M⊙ for comparison.
Current usage metrics show cumulative count of Article Views (full-text article views including HTML views, PDF and ePub downloads, according to the available data) and Abstracts Views on Vision4Press platform.
Data correspond to usage on the plateform after 2015. The current usage metrics is available 48-96 hours after online publication and is updated daily on week days.
Initial download of the metrics may take a while.