Fig. 7
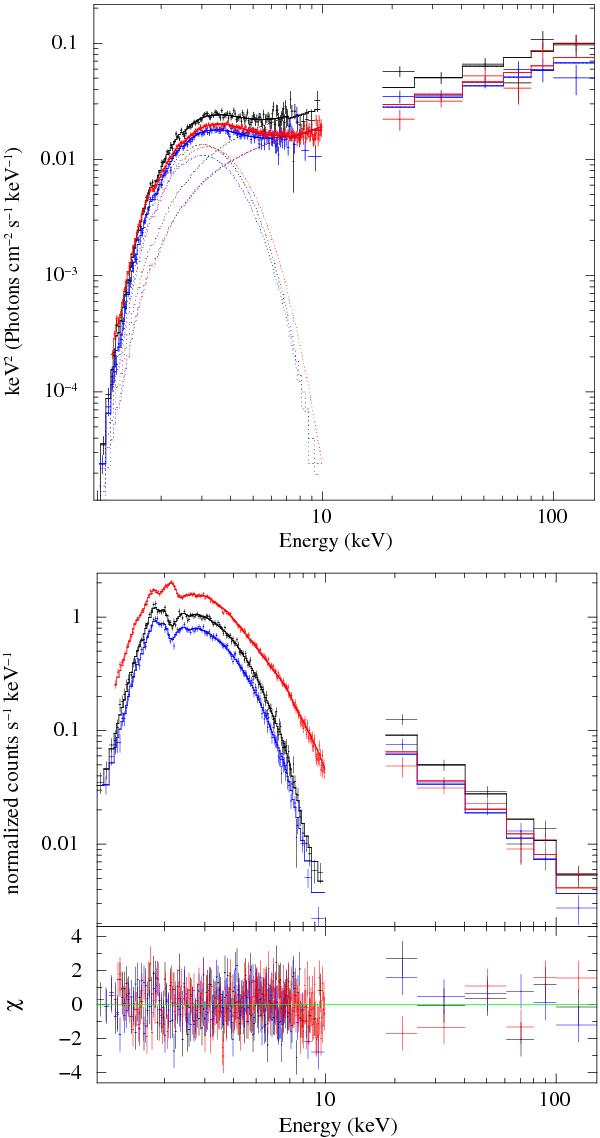
Upper panel: three partially overlapped in time 0.5–10 keV (Chandra and XMM-Newton) and 13–200 keV (INTEGRAL) observations. Spectral fits consist of the sum of a BB and a PL (black: Chandra data of Jan. 25, 2009; blue: Chandra data of Jan. 29, 2009; red: XMM-Newton data of Feb. 03, 2009. The same color code applies to the three INTEGRAL observations). Lower panel: the same as the left panel except that count spectra and models are plotted here. Fit residuals are shown in the bottom panel.
Current usage metrics show cumulative count of Article Views (full-text article views including HTML views, PDF and ePub downloads, according to the available data) and Abstracts Views on Vision4Press platform.
Data correspond to usage on the plateform after 2015. The current usage metrics is available 48-96 hours after online publication and is updated daily on week days.
Initial download of the metrics may take a while.