Fig. 5
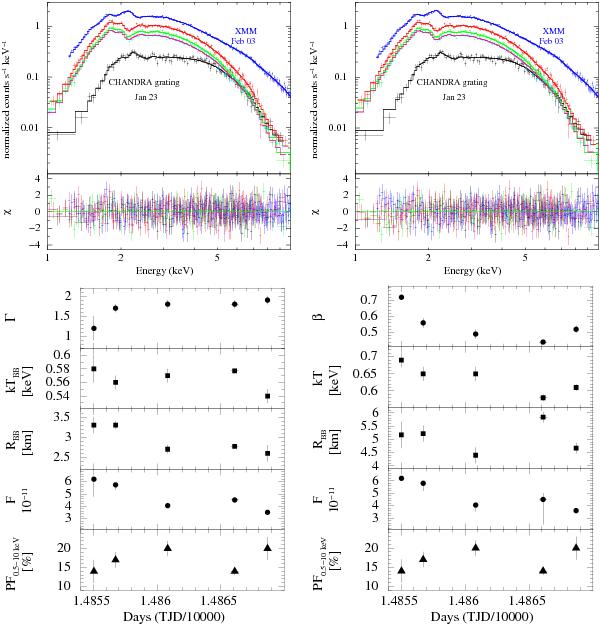
Upper panels: count spectra and models in the 0.5–10 keV energy range for different epochs (black points and lines are Jan. 23, 2009, red for Jan. 25, 2009, green for Jan. 29, 2009, blue for Feb. 03, 2009, and magenta is Feb. 06, 2009). Left: BB+PL model. Right: NTZ model. Fit residuals are shown in the bottom panels. Lower panels: time evolution of the best-fitting parameters inferred from the BB+PL (left) and NTZ (right) fits of the 0.5 − 10 keV spectra. The 0.5–10 keV flux (in units of 10-11 erg cm-2 s-1) and the PF evolution are also shown.

Current usage metrics show cumulative count of Article Views (full-text article views including HTML views, PDF and ePub downloads, according to the available data) and Abstracts Views on Vision4Press platform.
Data correspond to usage on the plateform after 2015. The current usage metrics is available 48-96 hours after online publication and is updated daily on week days.
Initial download of the metrics may take a while.