Fig. 3
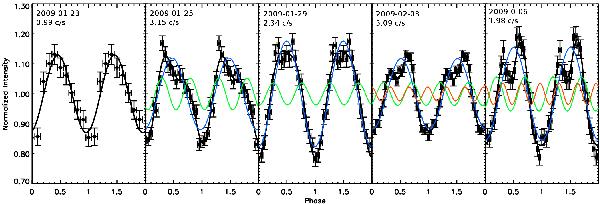
0.5 − 10 keV pulse profile evolution in time. Black: data and best fitting model. The different harmonics contributing to the best fit model are also shown: blue, green and red curves are the first, second and third harmonic, respectively (see text for details). The background subtracted average count rate is also reported in each panel. The low count rate of the Jan. 23, 2009 observation is due to the presence of the grating in front of the CCD, while the Feb. 03, 2009 observation was performed with XMM-Newton, which has a larger effective area with respect to Chandra.
Current usage metrics show cumulative count of Article Views (full-text article views including HTML views, PDF and ePub downloads, according to the available data) and Abstracts Views on Vision4Press platform.
Data correspond to usage on the plateform after 2015. The current usage metrics is available 48-96 hours after online publication and is updated daily on week days.
Initial download of the metrics may take a while.