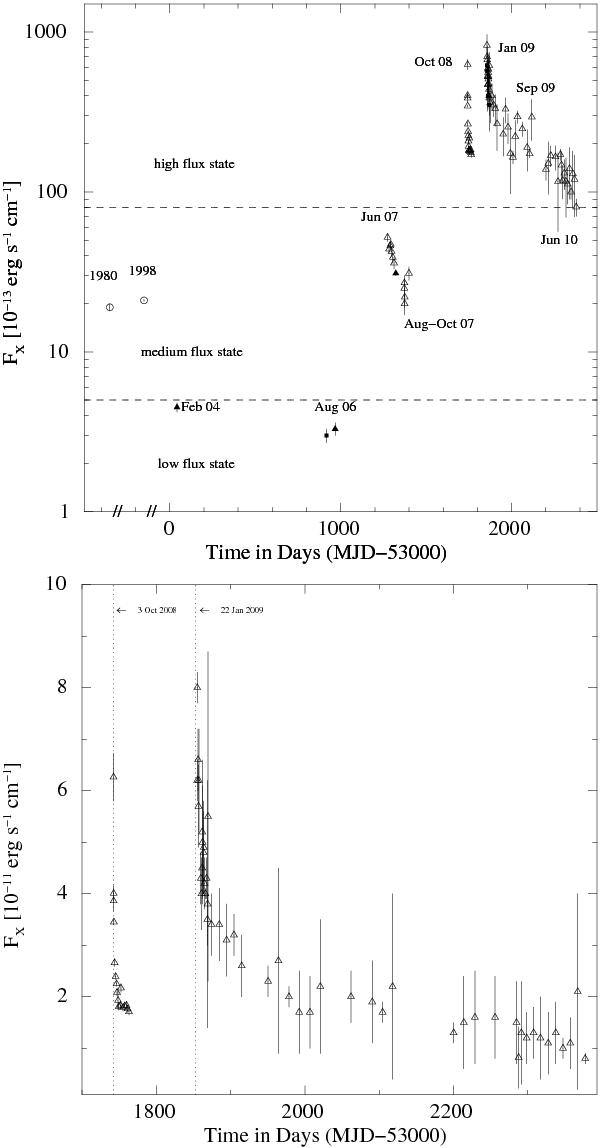
Fig. 1

Upper panel: X-ray flux vs. time. Empty triangles are 2 − 10 keV Swift data, black triangles are 0.5 − 10 keV XMM-Newton data, while black squares are 0.5 − 10 keV Chandra data, blank circles are 0.5 − 10 keV Einstein 1980 and ASCA 1998 data (the latter two values are from Gelfand & Gaensler 2007). The X axis below the zero value displays two discontinuity in order to easily compare the recorded fluxes with that of Einstein (1980) and ASCA (1998). The empirically selected horizontal dashed lines highlight the distinction among different flux states (see Sects. 4.2 and 4.4 for details). Lower panel: 2 − 10 keV flux for the October 2008 (Israel et al. 2010) and January 2009 outburst. Dotted vertical lines represent the two outbursts trigger time. Errors in both panels are 1σ c.l. All reported fluxes are not corrected for absorption.
Current usage metrics show cumulative count of Article Views (full-text article views including HTML views, PDF and ePub downloads, according to the available data) and Abstracts Views on Vision4Press platform.
Data correspond to usage on the plateform after 2015. The current usage metrics is available 48-96 hours after online publication and is updated daily on week days.
Initial download of the metrics may take a while.


