Fig. 8
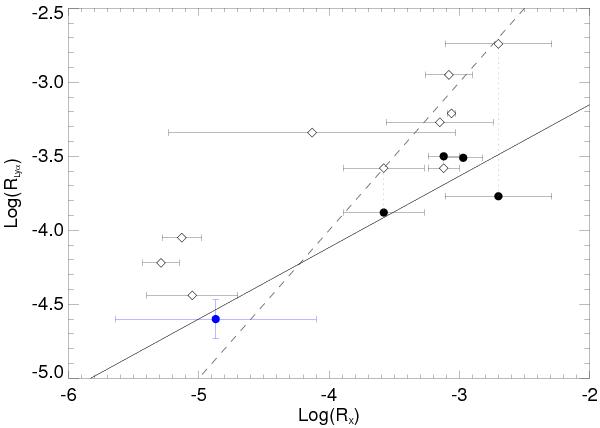
Normalized Lyα flux RLyα = fLyα/fbol as a function of normalized X-ray flux RX = fX/fbol for all the IUE (⋄) and HST (•) Lyα flux measurements of M dwarfs in the literature. Our measurement for GJ 436 data is shown in blue. The dotted lines link HST and IUE mesasurements for objects that have been measured with both instruments. The plain line show the best-fit linear regression to HST measurements, log (RLyα) ≈ 0.5log (RX) − 2.2. The grey dashed line indicates the log RLyα = log RX relation. The horizontal error bars in the X-ray flux are the dispersions reported in Table 2.
Current usage metrics show cumulative count of Article Views (full-text article views including HTML views, PDF and ePub downloads, according to the available data) and Abstracts Views on Vision4Press platform.
Data correspond to usage on the plateform after 2015. The current usage metrics is available 48-96 hours after online publication and is updated daily on week days.
Initial download of the metrics may take a while.