Free Access
Fig. 7
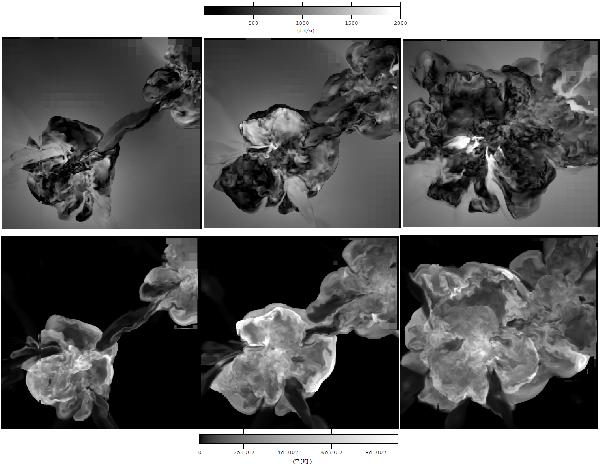
Time evolution for a slice cut through the center of the major merger cluster E26 (from left to right, images are taken at z = 0.79, z = 0.59 and z = 0.28). The bottom panels show the gas temperature, the top ones show the velocity module. The side of each slice is of 8 Mpc h-1.
This figure is made of several images, please see below:
Current usage metrics show cumulative count of Article Views (full-text article views including HTML views, PDF and ePub downloads, according to the available data) and Abstracts Views on Vision4Press platform.
Data correspond to usage on the plateform after 2015. The current usage metrics is available 48-96 hours after online publication and is updated daily on week days.
Initial download of the metrics may take a while.