Fig. 5
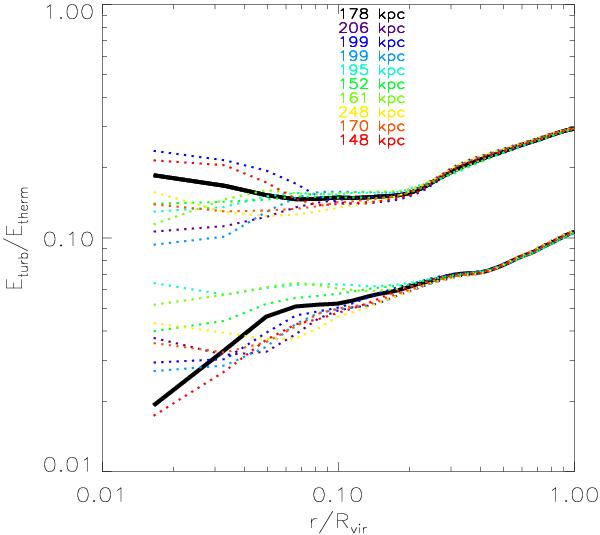
Average profiles of the cumulative turbulent to total energy ratio at z = 0, for nine random displacements from the putative center of mass of the cluster (solid black profiles). The top curves are for a post-merger cluster, the bottom curves for a relaxed cluster. The different colors refer to different displacements from the center (the corresponding absolute values being reported in the panel).
Current usage metrics show cumulative count of Article Views (full-text article views including HTML views, PDF and ePub downloads, according to the available data) and Abstracts Views on Vision4Press platform.
Data correspond to usage on the plateform after 2015. The current usage metrics is available 48-96 hours after online publication and is updated daily on week days.
Initial download of the metrics may take a while.