Fig. 18
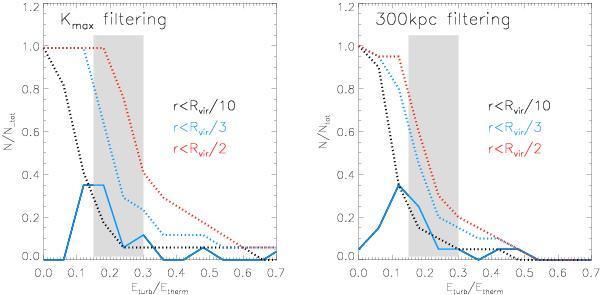
Distribution functions for Eturb/Etherm inside three reference radii (Rvir/2, Rvir/3, and Rvir/10) for the simulated clusters at z = 0. The left panel is for the turbulent ICM velocity field estimated using the lMAX filtering, while the right panel is for the filtering at lMAX = 300 kpc. The solid lines show the differential distributions (for r < Rvir/3 only), while the dashed lines show the cumulative distributions. The vertical gray band shows the approximate regime of turbulence required by calculating the turbulent re-acceleration of relativistic electrons (e.g. Brunetti & Lazarian 2007).
Current usage metrics show cumulative count of Article Views (full-text article views including HTML views, PDF and ePub downloads, according to the available data) and Abstracts Views on Vision4Press platform.
Data correspond to usage on the plateform after 2015. The current usage metrics is available 48-96 hours after online publication and is updated daily on week days.
Initial download of the metrics may take a while.