Fig. 12
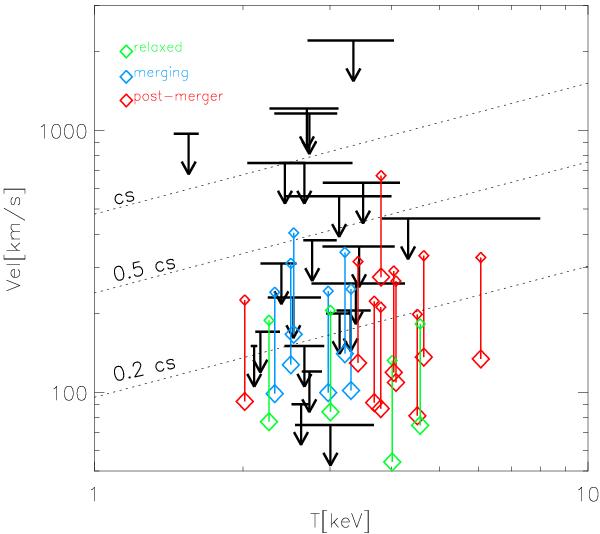
Scaling between the average temperature and the mean velocity dispersion (small squares) for all clusters of the simulated sample (squares in colors) and the cluster observed with XMM-Newton by Sanders et al. (2011). The additional dotted lines show the dependence of the ICM sound speed with the temperature. To compare with the observations, we filtered the velocity for the same spatial coherence scale of l ≈ 30 kpc available to Sanders et al. (2011); the data-point derived in this way are shown as connected thick squares.
Current usage metrics show cumulative count of Article Views (full-text article views including HTML views, PDF and ePub downloads, according to the available data) and Abstracts Views on Vision4Press platform.
Data correspond to usage on the plateform after 2015. The current usage metrics is available 48-96 hours after online publication and is updated daily on week days.
Initial download of the metrics may take a while.