Fig. A.1
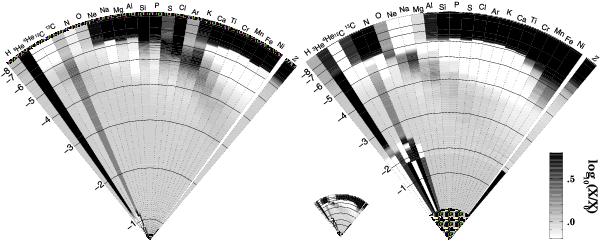
Black-and-white version of Fig. 4. Gray-coded concentrations in two HB stars of the same metallicity after 25 Myr on the HB. Left panel with a Teff of 14 000 K (0.59 M⊙) and right panel of 30 100 K (0.51 M⊙). The scale of the radius is linear, but the logarithmic value of the mass coordinate above a number of points, log ΔM/M∗, is shown to the left of the horizontal black line. The concentration scale is given in the right insert. Small circles near the top of the left panel mark the extent of the surface convection zone, while similar circles near the center of both models mark the central convection zone. The small inset in between the two panels shows the high Teff star on the radius scale of the low Teff star. For −7 < log ΔM/M∗ < −4 the concentration is quite different for many species. It is surprisingly so for C and O for log ΔM/M∗ > −2.
Current usage metrics show cumulative count of Article Views (full-text article views including HTML views, PDF and ePub downloads, according to the available data) and Abstracts Views on Vision4Press platform.
Data correspond to usage on the plateform after 2015. The current usage metrics is available 48-96 hours after online publication and is updated daily on week days.
Initial download of the metrics may take a while.