Fig. 9
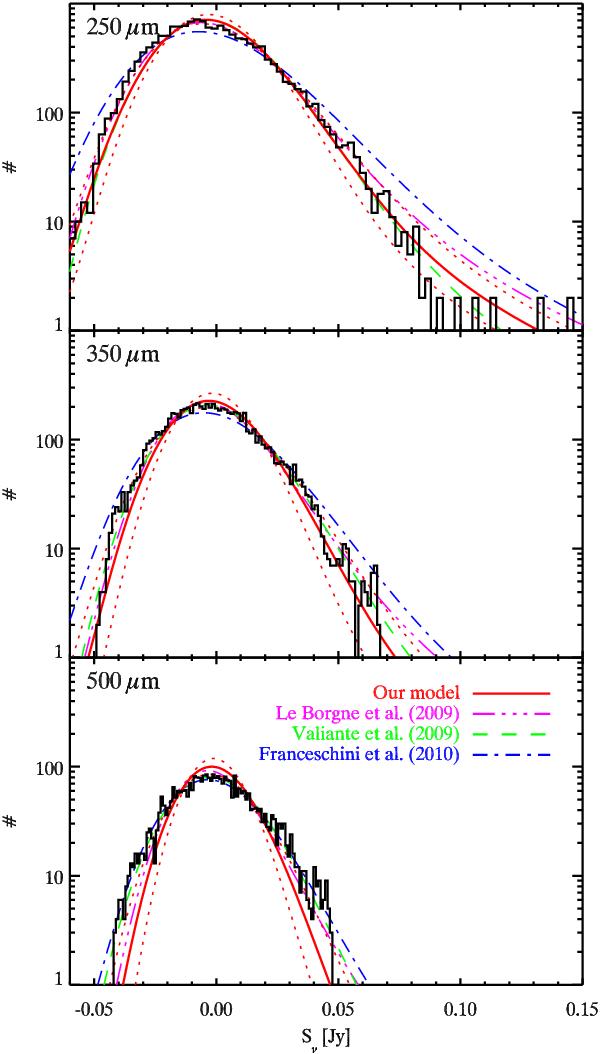
Comparison with the BLAST pixel histogram at 250 μm (upper panel), 350 μm (middle panel) and 500 μm (lower panel). Black histogram: histogram of the values of the central part of the BLAST beam-smoothed map in Jy/beam. Red solid line: distribution predicted by our model using a P(D) analysis. Our analysis does not include the clustering. Purple three dot-dashed line: Le Borgne et al. (2009) model. Green dashed line: Valiante et al. (2009) model. Blue dot-dashed line: Franceschini et al. (2010) model.
Current usage metrics show cumulative count of Article Views (full-text article views including HTML views, PDF and ePub downloads, according to the available data) and Abstracts Views on Vision4Press platform.
Data correspond to usage on the plateform after 2015. The current usage metrics is available 48-96 hours after online publication and is updated daily on week days.
Initial download of the metrics may take a while.