Fig. 7
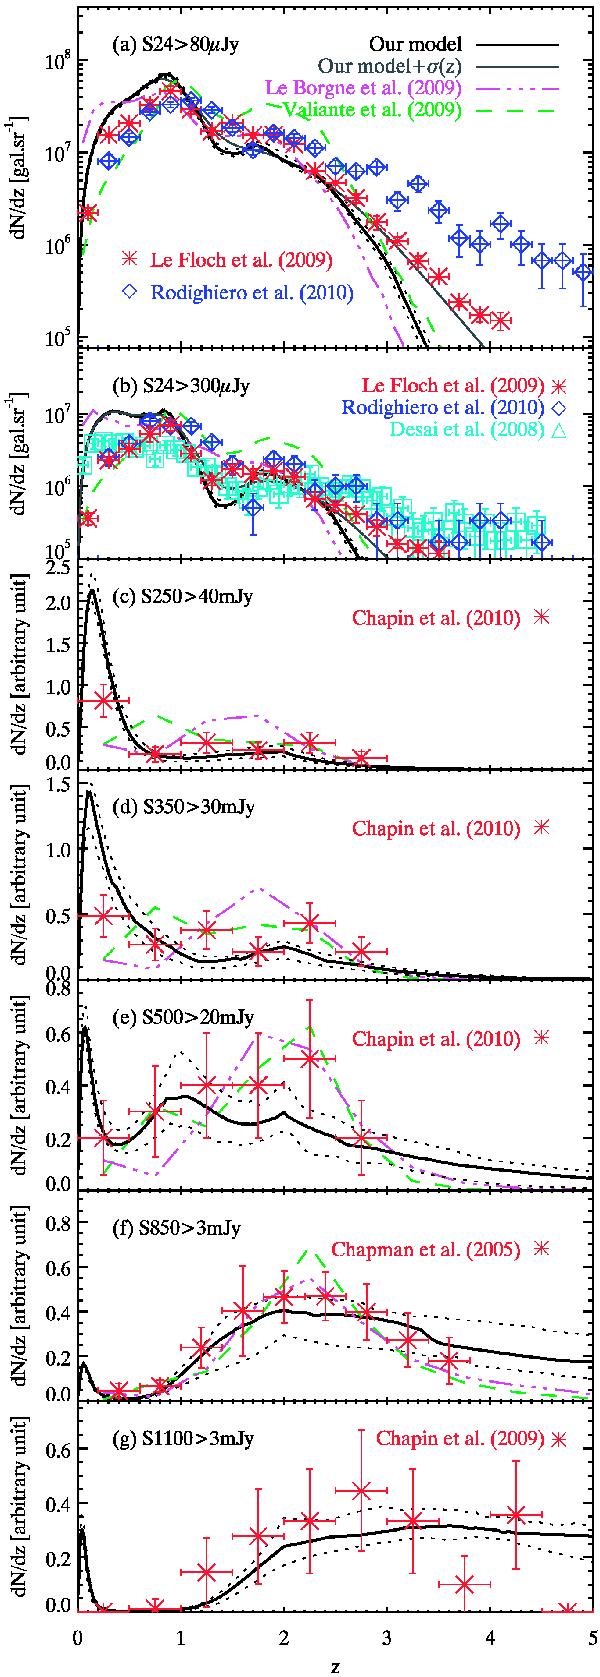
Redshift distribution of the S24 > 80 μJy a), S24 > 300 μJy b), S250 > 40 mJy c), S350 > 30 mJy d), S500 > 20 mJy e), S850 > 3 mJy f), and S1100 > 3 mJy g) sources. These measurements are not fitted. Black solid line: our best-fit model. Black dotted line: 1-σ range of the model. Grey solid line: our best-fit model convolved by a Gaussian of σz = 0.125z. Purple three dot-dashed line: Le Borgne et al. (2009) model. Green dashed line: Valiante et al. (2009) model. Red asterisks: Le Floc’h et al. (2009)a), b), Chapin et al. (2011)c)–e), Chapman et al. (2005)f) and Chapin et al. (2009)g) measurements. Blue diamonds: Rodighiero et al. (2010) measurements a), b). Cyan squares: Desai et al. (2008) measurements b).
Current usage metrics show cumulative count of Article Views (full-text article views including HTML views, PDF and ePub downloads, according to the available data) and Abstracts Views on Vision4Press platform.
Data correspond to usage on the plateform after 2015. The current usage metrics is available 48-96 hours after online publication and is updated daily on week days.
Initial download of the metrics may take a while.