Fig. 18
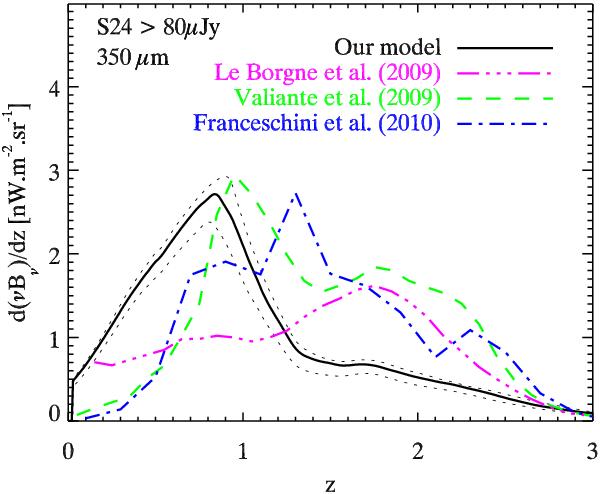
Differential contribution of the S24 > 80 μJy sources to the CIB as a function of the redshift at 350 μm. Black solid line: Our model (1-σ limit in black dotted line). Purple three dot-dashed line: Le Borgne et al. (2009) model. Green dashed line: Valiante et al. (2009) model. Blue dot-dashed line: Franceschini et al. (2010) model.
Current usage metrics show cumulative count of Article Views (full-text article views including HTML views, PDF and ePub downloads, according to the available data) and Abstracts Views on Vision4Press platform.
Data correspond to usage on the plateform after 2015. The current usage metrics is available 48-96 hours after online publication and is updated daily on week days.
Initial download of the metrics may take a while.