Fig. 14
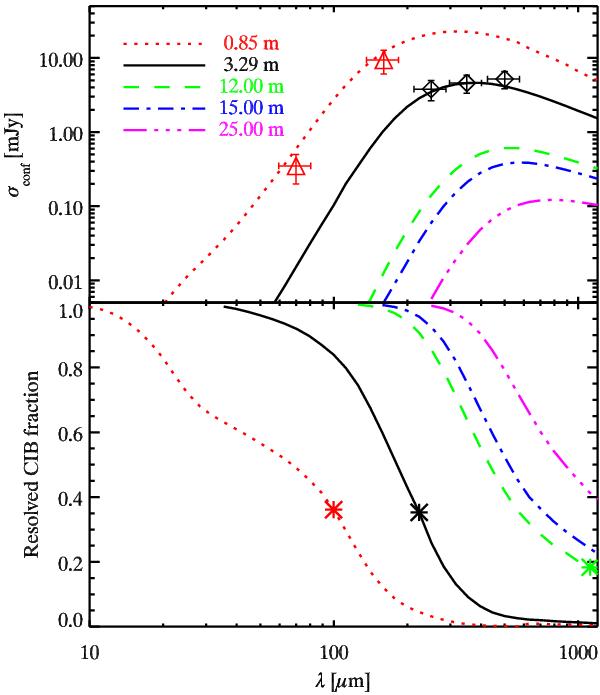
Upper panel: 1-σ confusion noise as a function of the wavelength for different telescope diameters. We use the confusion noise given by the P(D) method (see Sect. 7.1) for this plot. Red triangles: Frayer et al. (2009)Spitzer/MIPS confusion measurements. Black diamonds: Nguyen et al. (2010): Herschel/SPIRE confusion noise measurements (5-σconf cut). Lower panel: resolved fraction of the CIB by sources brighter than 5-σ confusion noise (fluctuations) and the source density limit. Both panel: Red dotted line: telescope with a diameter of 0.85 m such as Spitzer. Black solid line: 3.29 m telescope such as Herschel. Green dashed line: 12 m telescope such a Atacama pathfinder experiment (APEX). Blue dot-dashed line: 15 m telescope such as the JCMT. Purple three dot-dashed line: 25 m such as the CCAT project. Asterisks: transition between the source density limitation (short wavelengths) and the fluctuation limitation (long wavelengths).
Current usage metrics show cumulative count of Article Views (full-text article views including HTML views, PDF and ePub downloads, according to the available data) and Abstracts Views on Vision4Press platform.
Data correspond to usage on the plateform after 2015. The current usage metrics is available 48-96 hours after online publication and is updated daily on week days.
Initial download of the metrics may take a while.