Fig. 12
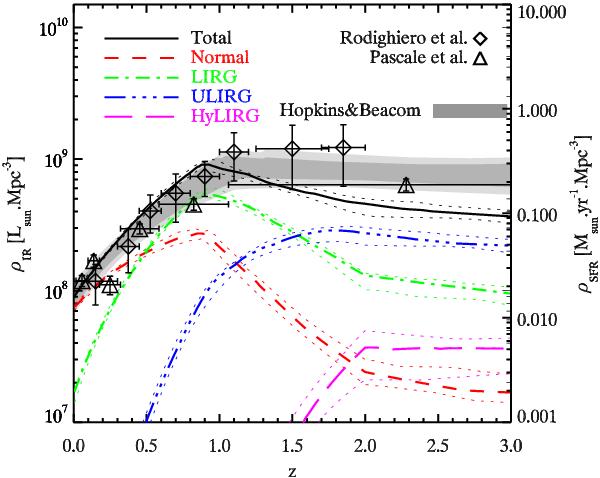
Evolution of the bolometric infrared luminosity density (black solid line) as a function of the redshift. The contribution of normal galaxies (LIR < 1011 L⊙), LIRG (1011 < LIR < 1012 L⊙), ULIRG (1012 < LIR < 1013 L⊙), and HyLIRG (LIR > 1013 L⊙) are plotted with short-dashed, dot-dash, three-dot-dash, and long-dashed line respectively. The measurements of Rodighiero et al. (2010) using the MIPS 24 μm data are plotted with diamonds and Pascale et al. (2009) ones using a BLAST stacking analysis with triangles. The Hopkins & Beacom (2006) fit to the optical and infrared measurement is plotted with a dark grey area (1-σ) and a light grey area (3-σ).
Current usage metrics show cumulative count of Article Views (full-text article views including HTML views, PDF and ePub downloads, according to the available data) and Abstracts Views on Vision4Press platform.
Data correspond to usage on the plateform after 2015. The current usage metrics is available 48-96 hours after online publication and is updated daily on week days.
Initial download of the metrics may take a while.