Fig. 11
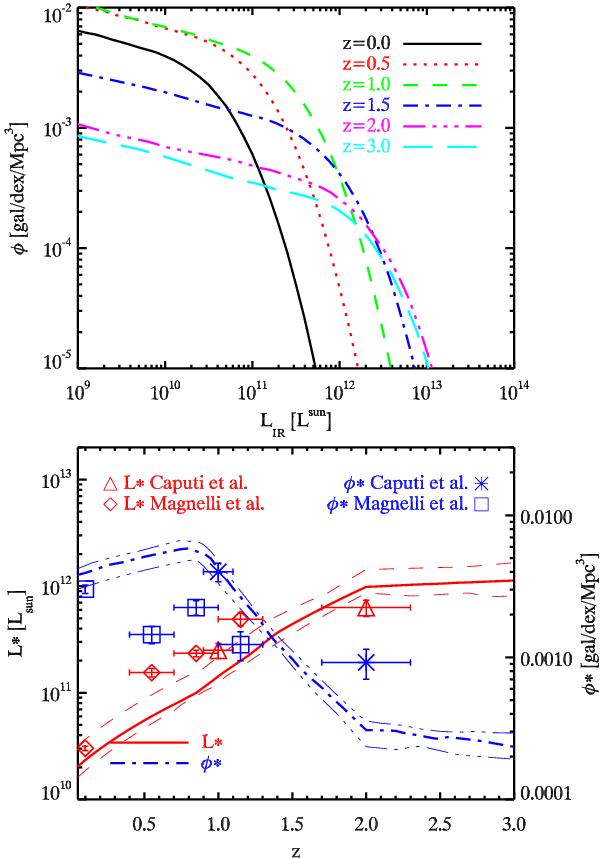
Evolution of the bolometric infrared luminosity function with redshift. Upper panel: bolometric LF at z = 0 (solid line), z = 0.5 (dot line), z = 1 (dashed line), z = 1.5 (dot-dash line), z = 2 (3-dot-dash line), and z = 3 (long dashed line). Lower panel: Evolution of the L ⋆ (red solid line) and φ ⋆ (blue dot-dash line) parameter as a function of redshift and 1-σ confidence region. The measurement of L ⋆ by Caputi et al. (2007) (triangles) using 24 μm obervations and Magnelli et al. (2009) (diamonds) using 70 μm observations are plotted in red. The measurement of φ ⋆ by Caputi et al. (2007) (cross) and Magnelli et al. (2009) (square) are in blue.
Current usage metrics show cumulative count of Article Views (full-text article views including HTML views, PDF and ePub downloads, according to the available data) and Abstracts Views on Vision4Press platform.
Data correspond to usage on the plateform after 2015. The current usage metrics is available 48-96 hours after online publication and is updated daily on week days.
Initial download of the metrics may take a while.