Fig. 9
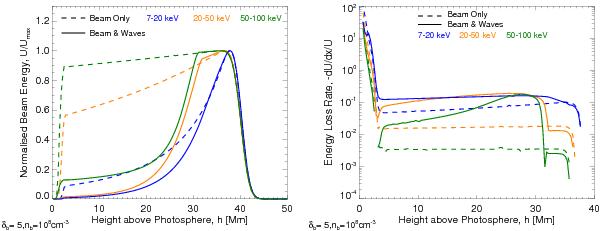
(Left) The time averaged beam energy U(x) for energy bands 7 − 20 keV, 20 − 50 keV and 50 − 100 keV (blue, orange and green respectively) for simulation with collisional transport (dashed lines, Beam Only) and additional wave-particle interactions (solid lines, Beam & Waves). (Right) The beam energy loss rate, normalised by the beam energy, for the same energy bands and simulations shown in the left panel.
Current usage metrics show cumulative count of Article Views (full-text article views including HTML views, PDF and ePub downloads, according to the available data) and Abstracts Views on Vision4Press platform.
Data correspond to usage on the plateform after 2015. The current usage metrics is available 48-96 hours after online publication and is updated daily on week days.
Initial download of the metrics may take a while.