Fig. 7
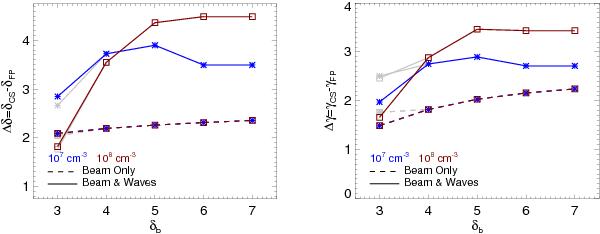
Difference in the spectral index of the coronal source and footpoint for the mean electron spectrum Δδ (left) and X-ray spectrum Δγ (right) as a function of the spectral index of the injected electron beam δb and beam density nb (blue 107 cm-3, red 108 cm-3). Shown are the results for the beam only propagation (subject only to Coulomb collisions) and the beams and waves simulation. The grey points indicate the results when a higher maximum velocity is used, discussed in Sect. 3.3.1.
Current usage metrics show cumulative count of Article Views (full-text article views including HTML views, PDF and ePub downloads, according to the available data) and Abstracts Views on Vision4Press platform.
Data correspond to usage on the plateform after 2015. The current usage metrics is available 48-96 hours after online publication and is updated daily on week days.
Initial download of the metrics may take a while.