Fig. 4
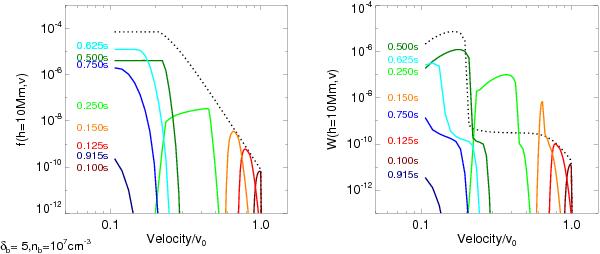
Electron f(v) and spectral wave energy W(v) distributions for height of 10 Mm above the photosphere. The dotted line indicates the distributions for the continuous injection case once a steady-state equilibrium has been reached (shown in Fig. 2) and the solid lines show the time evolution (different colours for different times as indicated) for the transient initially injected electron beam (shown in Fig. 3).
Current usage metrics show cumulative count of Article Views (full-text article views including HTML views, PDF and ePub downloads, according to the available data) and Abstracts Views on Vision4Press platform.
Data correspond to usage on the plateform after 2015. The current usage metrics is available 48-96 hours after online publication and is updated daily on week days.
Initial download of the metrics may take a while.