Fig. 3
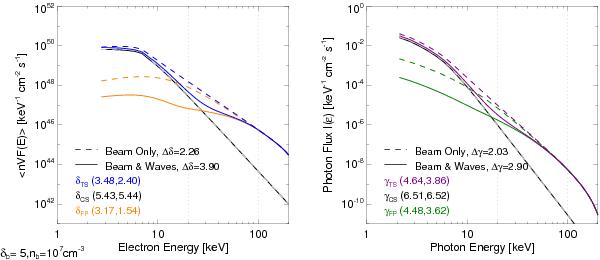
Mean electron flux spectrum (left) and X-ray spectrum (right) of a transient initially injected electron beam simulation over 1 s, for the footpoint (orange, green), coronal (black) and total source (blue, purple). Shown are the simulations considering only collisional transport of an electron beam (Beam Only, dashed lines) and the addition of wave-particle interactions (Beam & Waves, solid lines). The vertical dotted lines indicated the energy range a power law was fitted over. The fitted spectral indices are shown in brackets (Beam Only, Beam & Waves).
Current usage metrics show cumulative count of Article Views (full-text article views including HTML views, PDF and ePub downloads, according to the available data) and Abstracts Views on Vision4Press platform.
Data correspond to usage on the plateform after 2015. The current usage metrics is available 48-96 hours after online publication and is updated daily on week days.
Initial download of the metrics may take a while.