Fig. 1
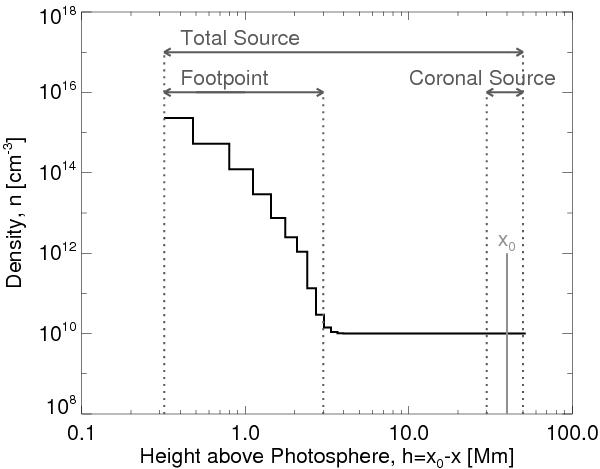
The background plasma density n(x) as a function of height above the photosphere. The vertical lines indicate the different spatial region the emission is summed over to produce the total, footpoint and coronal sources. The short grey vertical line x0 indicates a starting centroid height of the electron distribution at 40 Mm.
Current usage metrics show cumulative count of Article Views (full-text article views including HTML views, PDF and ePub downloads, according to the available data) and Abstracts Views on Vision4Press platform.
Data correspond to usage on the plateform after 2015. The current usage metrics is available 48-96 hours after online publication and is updated daily on week days.
Initial download of the metrics may take a while.