Fig. 5
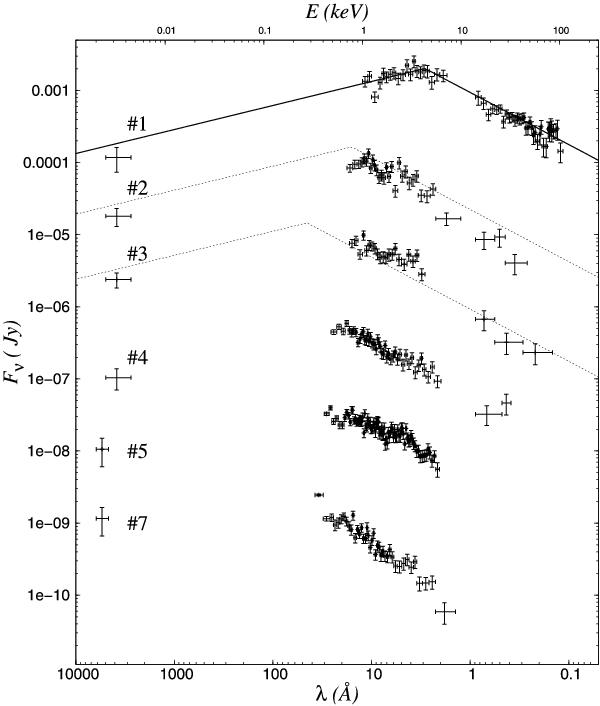
The spectral energy distribution of the combined early emission during the time when the first six optical data points were obtained by Swift/UVOT white and v filters. The corresponding time intervals are listed in Table 2. The fluxes of the curves #2, 3, 4, 5, and 7 have been multiplied for clarity by 10-1, 10-2, 10-3, 10-4, and 10-5, respectively. The fits for #2, 3 were obtained by fixing the high-energy slope to the corresponding slope obtained for SED #1, the low-energy slope to 1/3, and by matching the expected break energy following the nonstandard LAE model (Sect. 3.1.3).
Current usage metrics show cumulative count of Article Views (full-text article views including HTML views, PDF and ePub downloads, according to the available data) and Abstracts Views on Vision4Press platform.
Data correspond to usage on the plateform after 2015. The current usage metrics is available 48-96 hours after online publication and is updated daily on week days.
Initial download of the metrics may take a while.