Fig. 10
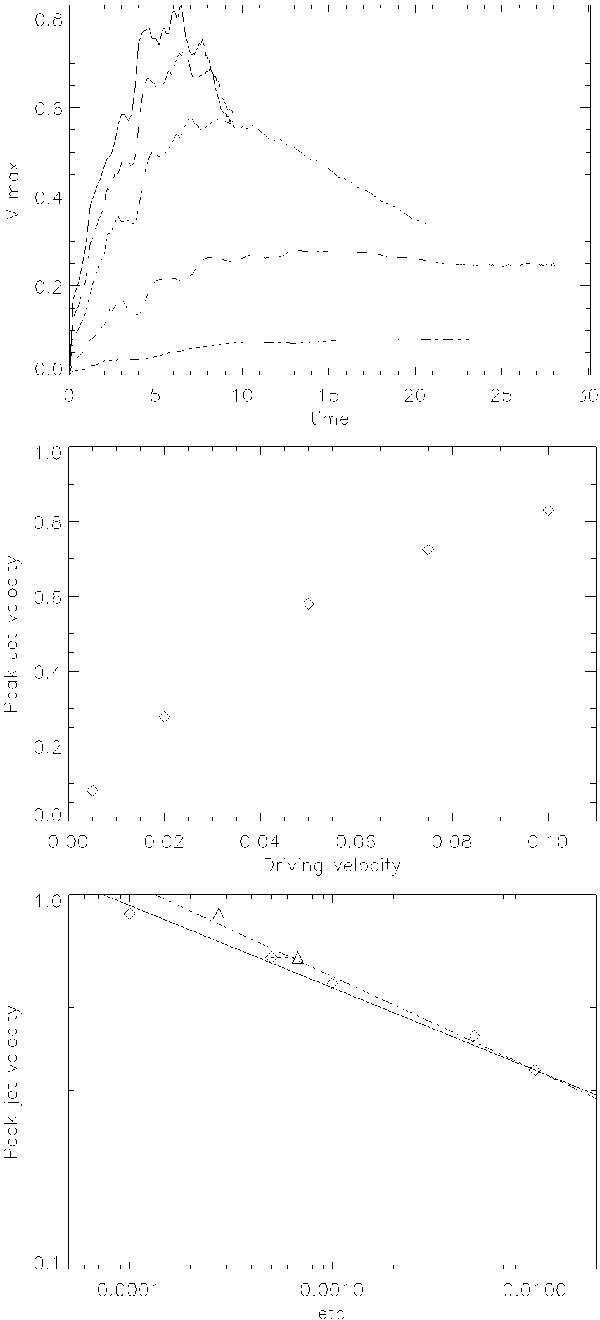
The top frame shows the time dependent evolution of the peak velocity, for the runs C1 (dot-dashed), C2 (dashed), C3 (triple-dot-dashed), C4 (long-dashed) and C5 (solid) (see Table 1). The middle frame shows the peak velocity as a function of the imposed driving velocity. The lower frame shows the peak velocity as a function of the imposed resistivity, η. The full line represents the scaling using the original values, Eq. (6), while the dot-dashed line included the corrected η values, Eq. (7).
Current usage metrics show cumulative count of Article Views (full-text article views including HTML views, PDF and ePub downloads, according to the available data) and Abstracts Views on Vision4Press platform.
Data correspond to usage on the plateform after 2015. The current usage metrics is available 48-96 hours after online publication and is updated daily on week days.
Initial download of the metrics may take a while.