Fig. 8
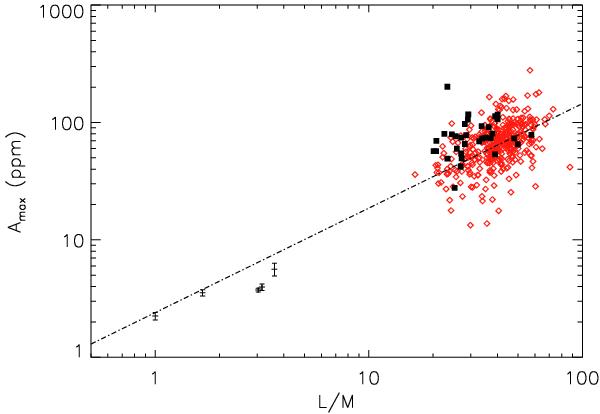
Measured mode amplitudes ( ∝  ) versus L/M for the red giants (L/M > 5) and for the main-sequence stars (L/M < 5). The results of Barban et al. (in prep.) appear as filled squares. The result of Carrier et al. (2010) for HD181907 is hidden by other red-giant results. The dot-dash line indicates the global fit to red giants and main-sequence stars.
Current usage metrics show cumulative count of Article Views (full-text article views including HTML views, PDF and ePub downloads, according to the available data) and Abstracts Views on Vision4Press platform.
Data correspond to usage on the plateform after 2015. The current usage metrics is available 48-96 hours after online publication and is updated daily on week days.
Initial download of the metrics may take a while.