| Issue |
A&A
Volume 535, November 2011
|
|
|---|---|---|
| Article Number | C1 | |
| Number of page(s) | 1 | |
| Section | Stellar structure and evolution | |
| DOI | https://doi.org/10.1051/0004-6361/201014037e | |
| Published online | 25 October 2011 | |
Amplitudes and lifetimes of solar-like oscillations observed by CoRoT (Corrigendum)
Red-giant versus main-sequence stars
1
Institut d’Astrophysique Spatiale, CNRS, Université Paris XI, 91405 Orsay Cedex, France
e-mail: This email address is being protected from spambots. You need JavaScript enabled to view it.
2
LESIA, Université Pierre et Marie Curie, Université Denis Diderot, Obs. de Paris, 92195 Meudon Cedex, France
3
Institut d’Astrophysique et de Géophysique, Université de Liège, Allée du 6 Août 17, 4000 Liège, Belgium
4
Instituut voor Sterrenkunde, KU Leuven, Celestijnenlaan 200D, 3001 Leuven, Belgium
5
School of Physics and Astronomy, University of Birmingham, Edgbaston, Birmingham B15 2TT, UK
6
Astronomical Institute “Anton Pannekoek”, University of Amsterdam, Science Park 904, 1098 XH Amsterdam, The Netherlands
7
Institut de Recherche en Astrophysique et Planétologie, CNRS, Université de Toulouse, 31400 Toulouse, France
8
Thüringer Landessternwarte, 07778 Tautenburg, Germany
9
University of Vienna, Institute for Astronomy, Türkenschanzstrasse 17, 1180 Vienna, Austria
10
Department of Physics and Astronomy, University of British Columbia, 6224 Agricultural Road, Vancouver, BC V6T 1Z1, Canada
Key words: stars: oscillations / methods: data analysis / asteroseismology / errata, addenda
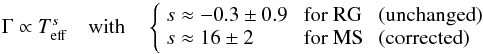
In Sects. 4.3 and 4.4, uncertainties were not properly taken into account in the computation of the scaling relation between mode widths (Sect. 4.3) and effective temperature for main-sequence stars (MS), and of the scaling relation between mode amplitude and effective temperature, again for main-sequence stars (other scaling relations are correct). The correct results are
 and:
and: 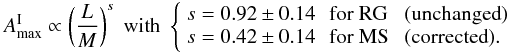 The corrected values are only slightly changed and well inside former uncertainties. Moreover, the corrected uncertainties are smaller than the former ones. Figure 7 is also slightly changed (see Fig. 1). The conclusions remain unchanged with these more precise results.
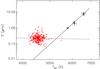 |
Fig. 1 Measured mode linewidths versus Teff for the red giants (Teff < 5000 K) and for the main-sequence stars (Teff > 5000 K). The dot-dash line indicates the fit to the red-giant width and the triple-dot-dash line the fit to main-sequence stars. |
Acknowledgments
This wrong computation was pointed out by T. Appourchaux who performed a thorough check of the former published results.
© ESO, 2011
All Figures
|
Fig. 1 Measured mode linewidths versus Teff for the red giants (Teff < 5000 K) and for the main-sequence stars (Teff > 5000 K). The dot-dash line indicates the fit to the red-giant width and the triple-dot-dash line the fit to main-sequence stars. |
| In the text | |
Current usage metrics show cumulative count of Article Views (full-text article views including HTML views, PDF and ePub downloads, according to the available data) and Abstracts Views on Vision4Press platform.
Data correspond to usage on the plateform after 2015. The current usage metrics is available 48-96 hours after online publication and is updated daily on week days.
Initial download of the metrics may take a while.