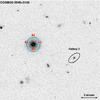
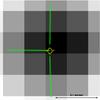
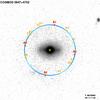
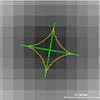
Fig. 7
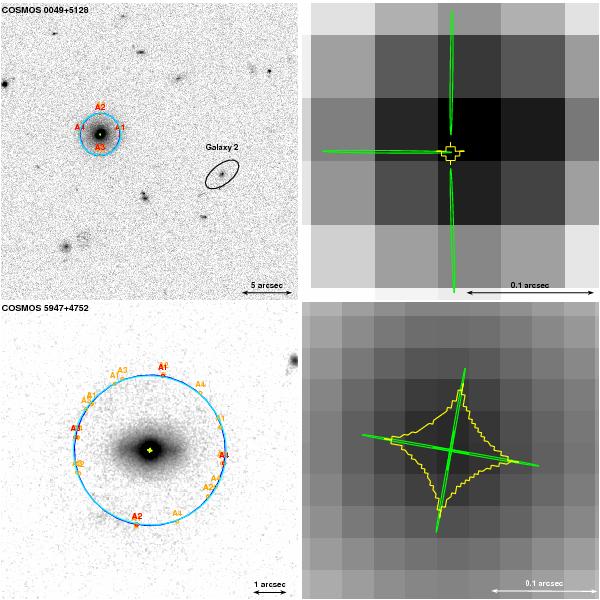
Mass models overlaid on ACS images for (top to bottom) COSMOS 0049+5128 and COSMOS 5947+4752. The left column displays the best mass model corresponding to the χ2 given in Table 7 (Col. 4 or 3 if no other). The right panel shows a zoom of the central region of the lens models, where the source can be seen. North is to the top and East to the left. Color code: the red circles are the observed images, whose radii correspond to the position uncertainty used in the modeling. In orange are the images produced by the best-lens model (in case of perfect fit, the orange and red crosses are superimposed). The navy blue lines describe the potential. The caustic lines are in yellow, and the critical lines are in cyan. The green ellipses show the position of the source as seen through the best-mass model (one source for each image; when a good fit is reached, the four sources are partially superimposed). We indicate the position of Galaxy 2 (see Sect. 4.2.1 and Table 8).
Current usage metrics show cumulative count of Article Views (full-text article views including HTML views, PDF and ePub downloads, according to the available data) and Abstracts Views on Vision4Press platform.
Data correspond to usage on the plateform after 2015. The current usage metrics is available 48-96 hours after online publication and is updated daily on week days.
Initial download of the metrics may take a while.