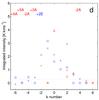
Fig. 7
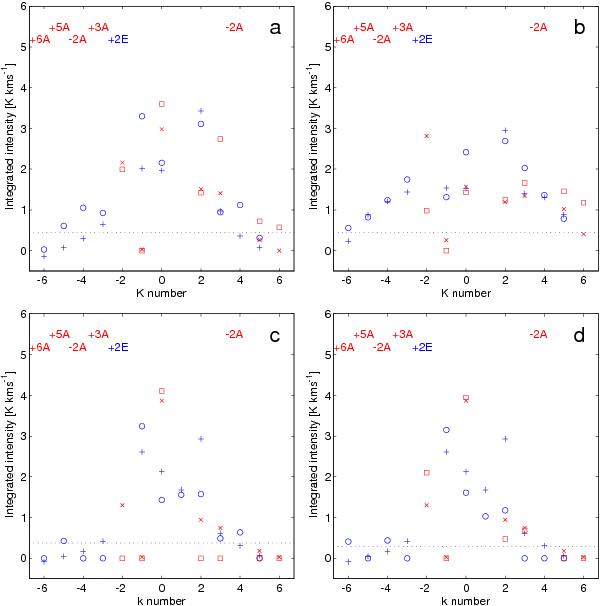
Plots of the integrated intensity for different CH3OH 7K → 6K transitions and the best χ2 model values. In the panels the observed flux (open symbols) is plotted, as well as the non-LTE model values (plusses and crosses). Also indicated is the 3σ detection limit. Circles and plusses (blue) are used for E-type lines and squares and crosses (red) for A-type. Labels on the top identify blended lines, for which the combined flux and model value are displayed. The K = + 1 line which is blended with an SO2 was not included in the analysis for the centre region components (top panels). The parameters of the fits are listed in Table 3. a) main, − 10.5 km s-1 velocity component at the “Centre” position with beam dilution factor of 1, b) redshifted, − 5.2 km s-1 velocity component at “Centre” with a beam dilution factor of 50, c) the “NE Outflow” and d) “Envelope”.
Current usage metrics show cumulative count of Article Views (full-text article views including HTML views, PDF and ePub downloads, according to the available data) and Abstracts Views on Vision4Press platform.
Data correspond to usage on the plateform after 2015. The current usage metrics is available 48-96 hours after online publication and is updated daily on week days.
Initial download of the metrics may take a while.