| Issue |
A&A
Volume 528, April 2011
|
|
|---|---|---|
| Article Number | A37 | |
| Number of page(s) | 16 | |
| Section | Atomic, molecular, and nuclear data | |
| DOI | https://doi.org/10.1051/0004-6361/201016251 | |
| Published online | 24 February 2011 | |
Wavelengths and oscillator strengths of Xe II from the UVES spectra of four HgMn stars
1
Istituto Nazionale di Astrofisica, Osservatorio Astronomico di
Trieste, via Tiepolo 11, 34143
Trieste,
Italy
e-mail: This email address is being protected from spambots. You need JavaScript enabled to view it.
2
Ankara University, Faculty of Science, Department of Astronomy and
Space Sciences, 06100
Tandoğan, Ankara,
Turkey
3
Astrophysical Institute Potsdam, An der Sternwarte 16, 14482
Potsdam,
Germany
Received: 2 December 2010
Accepted: 3 January 2011
Abstract
Aims. In spite of large overabundances of Xe ii observed in numerous mercury-manganese (HgMn) stars, Xe ii oscillator strengths are only available for a very limited number of transitions. As a consequence, several unidentified lines in the spectra of HgMn stars could be due to Xe ii. In addition, some predicted Xe ii lines are redshifted by about 0.1 Å from stellar unidentified lines, raising the question about the wavelength accuracy of the Xe ii line data available in the literature. For these reasons we investigated the Xe ii lines lying in the 3900–4521 Å, 4769–7542 Å, and 7660–8000 Å spectral ranges of four well-studied HgMn stars.
Methods. We compared the Xe ii wavelengths listed in the NIST database with the position of the lines observed in the high-resolution UVES spectrum of the xenon-overabundant, slowly rotating HgMn star HR 6000, and we modified them when needed. We derived astrophysical oscillator strengths for all the Xe ii observed lines and compared them with the literature values, when available. We checked the stellar atomic data derived from HR 6000 by using them to compute synthetic spectra for three other xenon-overabundant, slowly rotating HgMn stars, HD 71066, 46 Aql, and HD 175640. In this framework, we performed a complete abundance analysis of HD 71066, while we relied on our previous works for the other stars.
Results. We find that all the lines with wavelengths related to the 6d and 7s energy levels have a corresponding unidentified spectral line, blueshifted by the same quantity of about 0.1 Å in all the four stars, so that we identified these lines as coming from Xe ii and modified their NIST wavelength value according to the observed stellar value. We find that the Xe ii stellar oscillator strengths may differ from one star to another from 0.0 dex to 0.3 dex. We adopted the average of the oscillator strengths derived from the four stars as final astrophysical oscillator strength.
Key words: atomic data / stars: individual: HR 6000 / stars: chemically peculiar / stars: individual: HD 71066 / stars: individual: 46 Aql / stars: individual: HD 175640
© ESO, 2011
1. Introduction
Several studies of mercury-manganese (HgMn) stars have pointed out the presence of xenon with overabundances up to 5 dex relative to the solar value log (NXe/Ntot) = − 9.87 (Grevesse & Sauval 1998). This is, for instance, the case of κ Cnc and 33 Gem, for which abundances equal to −4.87 ± 0.13 dex and −4.90 ± 0.07 dex were determined by Dworetsky et al. (2008). The xenon overabundance implies the presence of numerous Xe ii lines in the spectra of the HgMn stars, but the Xe ii transition probabilities are very incomplete, when we compare the large number of transitions listed in the NIST database and the small number of them with an associated log gf-value. As a consequence, the computed spectra do not include numerous Xe ii lines, raising the doubt that some unidentified lines could just be due to Xe ii. In addition, we noticed that the wavelengths of several Xe ii lines are close, but not coincident with the wavelength of some unidentified stellar lines (Castelli & Hubrig 2007), so that we wondered about the accuracy of the wavelength determination from laboratory spectra.
The most complete work on Xe ii is that of Hansen & Persson (1987), who analyzed all the published (Boyce 1936; Humphreys 1939) and unpublished Xe ii lines from 392 Å to 10 220 Å obtained in laboratory by Humphreys and Boyce. In their discussion on the wavelength accuracy, Hansen & Persson (1987) pointed out that the wavelength accuracy for many lines is too low to be satisfactory, mostly owing to the widely varying quality of the experimental data they used. They announced new experimental work to improve the Xe ii atomic data. Unfortunately, this work has never been published up to now, all the more so that some preliminary results had indicated that, for the high 6d and 7s levels, there were shifts of about 0.5 cm-1 between the energy levels determined from the Humphrey wavelengths and the energy levels determined from the new data. This energy difference corresponds to a difference of 0.1 Å in wavelengths.
Saloman (2004), who performed a critical compilation of all the work on energy levels and wavelengths of Xe ii made up to that time, adopted the data from Hansen & Persson (1987) for almost all the lines of the optical region. The Saloman (2004) critical compilation is the one adopted by the NIST database.
To study wavelengths and log gf-values of the Xe ii lines having intensities ≥ 100 in the NIST line list, we used UVES spectra of the four xenon overabundant HgMn stars HR 6000, HD 71066, 46 Aql, and HD 175640. They are slowly rotating stars with vsini 1.5 km s-1, 1.5 km s-1, 1.0 km s-1, and 2.5 km s-1, respectively.
We already performed a complete abundance analysis for HD 175640 (Castelli & Hubrig 2004a)1 and for HR 6000 and 46 Aql (Castelli et al. 2009)2. To be consistent with the other papers, we present here an abundance analysis of HD 71066, which was studied with the same methods as adopted for the other stars. A previous work on HD 71066, related to vertical abundance stratification in HgMn stars, was performed by Thiam et al. (2010), who adopted the same observations as are used in this paper. We note, however, that no mention about Xe ii was made in their study.
2. Observations and data reduction
All the stars were observed at the European Southern Observatory (ESO) using the Very Large Telescope Ultraviolet and Visible Echelle Spectrograph (UVES) with a resolving power ranging from 80 000 to 110 000.
HD 175640 was observed on June 13, 2001 (Castelli & Hubrig 2004a). HR 6000, 46 Aql, and HD 71066 were part of the same observational run (ESO program 076.D-0169(A)). The spectra of HR 6000 were observed on September 19, 2005, those of 46 Aql on October 18, 2005 (Castelli et al. 2009), while the spectra of HD 71066 were taken on October 27, 2005. Because Nunez et al. (2010) found spectral variations in 19 HgMn stars out of a sample of 28 HgMn stars analyzed, we investigate about a possible variability of HD 71066 by comparing the spectrum observed in 2005 with an UVES spectrum observed in April 2004. We did not find any clear indication of variability.
The spectra of the four stars cover the region 3030−10 000 Å. For HD 175640 there are two gaps at λλ 5759−5835 Å and 8519−8656 Å. For the other three stars, the gaps occur at 4520−4769 Å and 7536−7660 Å. All the spectra were reduced by the UVES pipeline Data Reduction Software (Ballester et al. 2000). We analyzed flux-calibrated spectra for the 3050–5750 Å region and RED−SCI−POINT spectra for the 5750–9460 Å interval, in that flux-calibrated reduction for the red spectra was not implemented in the pipeline reduction procedure.
The measurement procedures on the spectra of HD 175640, HR 6000, and 46 Aql were described in Castelli & Hubrig (2004a) and Castelli & Hubrig (2007). The spectra of HD 71066 were normalized to the continuum using the IRAF continuum task. The equivalent widths were measured by a Gaussian fitting using the IRAF splot task.
The signal-to-noise ratio (S/N) is different for the different stars. In the spectra of HD 175640, it ranges from 200 in the near UV to 400 in the visual region. It is higher than the S/N of the spectra of the other three stars, which were observed in a different epoch. Furthermore, for each star, it is different in the different spectral intervals. For instance, for HR 6000, it is about 100 in the 5800 − 6800 Å interval and lowers to about 25 at 7400 Å (REDL spectrum). It is about 50 at 7800 Å and decreases to about 25 at 9400 Å (REDU spectrum). This behavior is similar for 46 Aql and HD 71066. At 6800 Å the S/N is about 100 for HR 6000, 70 for 46 Aql, 100 for HD 71066, and 125 for HD 175640.
3. The HgMn star HD 71066
Previous studies of HD 71066 (κ2 Vol, HR 3302) have pointed out the isotopic anomaly of Hg (Dolk et al. 2003; Thiam et al. 2010). No vertical abundance stratification for Ti, Cr, and Fe is found by Thiam et al. (2010). No presence of magnetic field is found both from the inspection of the equivalent widths of the Fe ii lines at 6147.7 Å and 6149.2 Å (Hubrig et al. 1999) and after using the FORS 1 spectropolarimeter at the VLT (Hubrig et al. 2006).
3.1. Model parameters and abundances of HD 71066
The starting model parameters of HD 71066, Teff = 12 045 K, and log g = 3.9 were derived both from the Strömgren photometry and the Fe i − Fe ii ionization equilibrium constraint.
The observed colors (b − y) = −0.053, m = 0.122, c = 0.731 β = 2.769 were taken from the Hauck & Mermilliod (1998) Catalogue3. The synthetic colors were taken from the grid computed by Castelli for [M/H] = 0 and microturbulent velocity ξ = 0 km s-14. Zero reddening was adopted for this star, in agreement with the results from the UVBYLIST code of Moon (1985). Observed c and β indices are reproduced by synthetic indices for model parameters Teff = 12 045 K and log g = 3.9
The parameters from the photometry were used for computing an ATLAS9 model with solar abundances for all the elements and zero microturbulent velocity. Using the WIDTH code (Kurucz 2005), we derived the Fe i and Fe ii abundance from the equivalent widths of 12 Fe i lines and 26 Fe ii lines. Seven of the Fe ii lines are transitions between high-excitation energy levels, and they have experimental log gf-values. They were used to determine the iron abundance, in that they are rather independent of Teff and log g (Castelli et al. 2009). Then, we searched for the model atmosphere giving this same abundance from both Fe i lines and low-excitation Fe ii lines. All the adopted lines are listed in Table A.1 of Appendix A (online material). We find that the ATLAS9 model with the parameters Teff = 12 045 K, log g = 3.9 derived from the Strömgren photometry meets the requirement of same iron abundance from all the different kinds of iron lines. In fact, it gives an average abundance log (N(Fe )/Ntot) equal to −3.88 ± 0.08 from the Fe i lines, −3.92 ± 0.12 from the low-excitation Fe ii lines, and −3.84 ± 0.05 from the Fe ii high-excitation lines.
The ATLAS9 model was used to derive the abundance for all those elements that show lines in the synthetic spectrum when solar abundance is adopted for them. Whenever possible, equivalent widths were measured to derive the abundances. For weak and blended lines and for lines that are blends of transitions belonging to the same multiplet, such as Mg ii 4481 Å, He i lines, and most O i profiles, we derived the abundance from the line profiles. The synthetic spectrum was also used to determine upper abundance limits from those lines predicted for solar abundances, but not observed.
Abundances log (Nelem/Ntot) for HD 71066.
The SYNTHE code (Kurucz 1993), together with updated Kurucz line lists (Castelli & Hubrig 2004a; Castelli & Kurucz 2010), were used to compute the synthetic spectrum. The synthetic spectrum was broadened for the instrumental profile and for a rotational velocity vsini = 1.5 km s-1, which was derived from the comparison of the observed and computed profile of Mg ii at 4481 Å.
Once all the abundances had been determined in this way, we computed an ATLAS12 model for the individual abundances having the same parameters as the ATLAS9 model. We used the seven Fe ii high-excitation lines to determine the new iron abundance. The ATLAS12 parameters were then modified until obtaining the same iron abundance, within the error limits, from both the Fe i lines and the low-excitation Fe ii lines. The average iron abundances from Fe i, Fe ii low-excitation, and Fe ii high-excitation lines are −3.85 ± 0.07, −3.87 ± 0.12, and −3.81 ± 0.05, respectively, for an ATLAS12 model with parameters Teff = 12 000 K and log g = 4.1. This model also leads to good agreement between the observed and computed Hα profiles. The abundances of HD 71066 derived from the ATLAS12 model either from equivalent widths or line profiles are listed in Table 1.
We also see As ii lines at 4466.348 (weak), 4494.23 (weak), 5105.58, 5231.38, 5331.23, 5497.727, 5558.09, 5651.32, 6110.07, and 6170.27 Å were observed in the spectrum. Owing to the lack of log gf-values for all the optical As ii transitions, we can only infer overabundance of this element in HD 71066. A guessed abundance of − 6.3 dex for arsenic was derived from measured equivalent widths and from guessed log gf-values (Table A.1 and Table 1).
In addition to the overabundance of arsenic and to the large overabundance of iron ([+ 0.69]), overabundances of P ([+1.5]), Na ([+0.2]), Ti ([+0.6]), Cr ([+0.2]), Mn ([+0.7]), Sr ([+0.8]), Y ([+2.2]), Xe ([+4.4]), Nd ([+0.9]), Dy ([+1.0], Au ([+3.9]), and Hg ([+4.5]) were observed. The other elements – He, Be, C, N, O, Ne, Mg, Al, Si, S, Ca, S, V, Co, Ni, Cu, and Zn – are underabundant.
No Pt ii lines were observed. A weak line at 4046.58 Å is Hg i at 4046.56, which is surely not blended with Pt ii at 4046.433 Å, because the spectral resolution is high enough, and the rotational velocity is low enough to permit us to see Pt ii when it is present. Furthermore, the line observed is reproduced well by assuming the mercury abundance and the isotopic composition deduced from Hg ii at 3984 Å (Sect. 3.3).
The comparison with the abundances by Thiam et al. (2010) has shown close agreement between the two determinations. Because Thiam et al. (2010) use an ATLAS9 model computed for solar abundances, the ATLAS12 model computed for an individual abundance may be estimated as unnecessary. However, in addition to the closer values for the Fe i and Fe ii abundances obtained with the ATLAS12 model, the consistency of the elemental abundances in the model and in the synthetic spectrum generally gives better agreement between the observed and computed profiles, in particular for the hydrogen profiles when He-weak stars are concerned.
3.2. Emission lines
Emission lines were observed for C i, Ti ii, Cr ii, Mn ii, and possibly for Fe ii. Most emissions are so weak that we stated their presence mostly on the basis of the emissions observed in other stars, in particular HD 175640 (Castelli & Hubrig 2004a). The emissions greater than the spectral noise are those listed in Table 2. The atomic data are taken from the Kurucz database5. For Mn ii mult. 13, only the transition at 6125.861 Å shows true emission, while the other lines at λλ 6122.434, 6126.225, 6128.734, 6129.033, 6130.796, and 6131.923 Å are observed to be much weaker than computed, so that we assume that also these Mn II lines are affected by emission.
The strongest emission lines in HD 71066, with the atomic data and configurations from the Kurucz website (see footnote 5).
3.3. Isotopic anomalies
We found an anomalous isotopic composition in HD 71066 for mercury and calcium. Dolk et al. (2003) have determined an anomalous isotopic composition for Hg by analyzing the line of Hg ii at 3984 Å. Table 3 shows that our results agree with theirs, while they are somewhat different from those of Thiam et al. (2010). We also obtained very good agreement between the observed and computed line Hg i at 4046.5 Å by adopting the same isotopic composition and abundance ( − 6.4 dex) derived from Hg ii at 3984 Å.
The lines of the Ca ii infrared triplet at λλ 8498.023, 8542.091, and 8662.14 Å are redshifted by 0.16 dex. Such a shift, observed in numerous HgMn stars and Ap stars (Cowley et al. 2007) was discovered by Castelli & Hubrig (2004b), who interpret it as due to an anomalous calcium isotopic composition.
4. The xenon abundance in HR 6000, HD 71066, 46 Aql, and HD 175640
To compute the Xe ii line spectrum we derived the xenon abundance in each star from the equivalent widths of a set of unblended Xe ii lines. The WIDTH code (Kurucz 2005) was used. The selected lines and their atomic data are listed in Table 4. Wavelengths and log gf-values were taken from the NIST database (Version 4)6. We assumed the classical radiative damping constant γR = 0.2223 × 10¹⁶/λ2 s-1 for λ in Å. For Stark broadening we used the experimental results from Djurovic et al. (2006). Because they are given for a temperature of T = 22 000 K, we investigated the effect of the temperature on the Stark damping constant γS. We interpolated for T = 12 000 K in the tables from Popovic & Dimitrijevic (1996), which list Stark widths computed at different temperatures. The last two columns of Table 4 compare γS values from Djurovic et al. (2006, Dj) with the interpolated values for temperature from Popovic & Dimitrijevic (1996, PD). We found that the differences in γS from the two sources do not affect the abundances more than 0.01 dex. The approximations of the WIDTH code were used (Castelli 2005) for no available Stark damping constants and for Van der Waals damping constants.
The measured equivalent widths of the selected Xe ii lines and the corresponding abundances are given in Table 5.
5. Stellar wavelengths and the astrophysical log gf-values for Xe II
Because xenon is more abundant in HR 6000 than in the other stars, we searched in the HR 6000 spectra for those Xe ii lines with an intensity equal to or higher than 100 in the NIST line list. When these lines were observed in the spectra, they were added in our line list. For lines with no available log gf-values, we assigned guessed values based on the line intensity. We examined the interval 3900–8000 Å with two gaps in the 4525−4780 Å and 7536−7660 Å regions, due to the lack of spectra in these ranges.
A synthetic spectrum for HR 6000 was computed for the xenon abundance given in Table 5 and for the abundances of all the other elements as derived by Castelli et al. (2009). In all the stars, the wavelength scale was fixed by shifting the observed spectrum on the computed spectrum until overimposing some lines with well-determined wavelength values such as Ca ii 3933.663 Å, Mg ii 4481.126 Å, 4481.150 Å, 4481.325 Å , and several strong Fe ii lines.
For all the considered Xe ii lines, we adjusted the log gf-value until the observed and computed profiles agree best. For several lines we also adjusted the NIST wavelength, because we noticed that, while they do not have an observed counterpart, they are close to an unidentified stellar line with wavelength blueshifted up to 0.1 Å from the predicted Xe ii line.
The astrophysical log gf-values and the adjusted wavelengths were then checked on the three other stars by comparing their observed spectra with synthetic spectra computed with the Xe ii wavelengths and oscillator strengths obtained from the spectrum of HR 6000. The Xe ii abundances adopted for the three stars are those given in Table 5. Table B.1 in Appendix B lists wavelengths and log gf-values as derived from the four stars. We found that for all the examined transitions, the stellar wavelength is the same in the four stars, except for the lines at 5260.44 Å and 6343.96 Å. The largest difference between stellar and NIST wavelength is − 0.13 Å observed for the line at 4330.52 Å. This line, as well as all the other lines with Δλ ~ − 0.1 Å has a 6d or a 7s level as upper level. The uncertainty of the energy of these levels is on the order of 0.5 cm-1 according to Hansen & Persson (1987).
Atomic data for selected Xe II lines.
Xenon abundance from the measured equivalent widths of HR 6000, 46 Aql, HD 71066, and HD 175640, for each star, using ATLAS12 models with parameters Teff and log g given in the table.
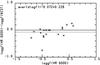 |
Fig. 1 Comparison of astrophysical log gf-values of Xe ii derived from HR 6000 with the log gf-values of the NIST critical compilation. |
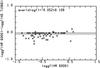 |
Fig. 2 Comparison of astrophysical log gf-values of Xe ii derived from HR 6000 with the astrophysical log gf-values derived from HD 71066. |
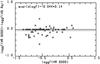 |
Fig. 3 Comparison of astrophysical log gf-values of Xe ii derived from HR 6000 with the astrophysical log gf-values derived from 46 Aql. |
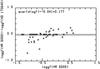 |
Fig. 4 Comparison of astrophysical log gf-values of Xe ii derived from HR 6000 with the astrophysical log gf-values derived from HD 175640. |
Figures 1–4 show the comparison of the HR 6000 astrophysical log gf-values for Xe ii with the log gf-values taken from the NIST database and log gf-values derived from the spectra of HD 71066, 46 Aql, and HD 175640, respectively (Table B.1, Col. 5). The largest discrepancy with the NIST data occurs for the line at 4414.84 Å. We adopted the stellar log gf-value for it because it gives an excellent agreement between the observed and computed profiles in all the four stars we examined. The comparison of the astrophysical log gf-values of HR 6000 with those from the other stars shows that they are on average lower by about 0.04–0.05 dex than those from the other stars and that the mean square deviation from the average increases with the decrease in the xenon abundance. We note that the weaker a line, the more uncertain its astrophysical log gf-value, mostly when the noise is not negligible. In particular, red spectra are affected both by rather large noise and by numerous telluric lines that lower the accuracy of the results.
The final line list for Xe ii is shown in Table 6. Columns 1 and 2 give the wavelength derived from the stellar spectra and the astrophysical log gf-value obtained by averaging the astrophysical log gf-values from the four stars. The associated error is the standard deviation from the mean. When it is not given, it means that the log gf-value was obtained from only one star. Columns 3 and 4 list log gf-values from the literature and the source. The literature sources are the NIST database, version 4 (NIST4), and Zíelińska et al. (2002) (ZBD). Zíelińska et al. (2002) estimate that, in general, their experimental transition rates agree with the NIST critical compilation made by Reader et al. (1980), which is the one adopted in the NIST4 database.
The last column gives the γStark parameter, which was determined as described in Sect. 4. Figure 5 shows, for each studied star, the comparison of the observed and computed spectra in the region of the Xe ii line with wavelength 4462.190 Å, according to the NIST database, and 4462.090 Å, according to Table 6. The wavelength shift of 0.1 Å and the astrophysical log gf value of + 0.33, which are the same for all the stars, provide excellent agreement between the observed and computed Xe ii profiles.
6. Conclusions
From the high resolution stellar spectra of four HgMn stars we derived both wavelengths and log gf-values for 100 Xe ii lines, which should also be observable in the spectra of numerous others chemically peculiar B-type stars. Of these lines, only 22 lines have log gf-values available in the NIST database. The NIST wavelength of two of them, 4180.10 Å and 4330.52 Å, differs by about 0.1 Å from that observed in the spectra. There is a total of 27 lines in our sample for which the observed wavelength differs from the NIST wavelength by more than − 0.06 Å with the maximum shift of − 0.13 Å for the line at 4330.52 Å. We believe that the wavelength differences are mostly the result of uncorrect energy levels, in that they are all related to 6d or 7s levels, which have an uncertainty of about 0.5 cm-1 according to Hansen & Persson (1987). This hypothesis seems us to be more relastic than that of some isotopic anomaly for Xe. For instance, using the isotopic wavelengths from Alvarez et al. (1979), Castelli & Hubrig (2007) excluded that the blueshift of 0.03 Å observed for the Xe ii line at 6051.15 Å can be due to some isotopic anomaly. Instead, because no isotopic composition was considered in our computations, owing to the lack of isotopic wavelengths for Xe ii, we could explain the larger astrophysical log gf-value than the experimental one obtained for a few lines with the presence of the xenon isotopes, which should not be neglected in the computations of the strongest Xe ii line profiles. Good examples are the lines at 4844.33 Å, 5292.22 Å, and 5419.155 Å (Table 6).
On the basis of the wavelength shifts observed in the stellar spectra we redetermined the energy of three 7s, one 5d, and eighteen 6d levels. These levels, together with the old and new energy values, are listed in Table 7. We would like to point out that the new energy values depend, of course, on the accuracy of the energy of the lower level.
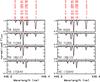 |
Fig. 5 Comparison for the four stars of the observed (black line) and computed (red line) spectra in the region of the Xe ii line with wavelength 446.2190 nm according to the NIST database (left panel) and with wavelength 446.2090 nm according to this paper (right panel). The line identification can be decoded as follows: for the first line, 898 last 3 digits of wavelength 446.0898 nm; 26 atomic number of iron; .01 charge/100; i.e., 26.01 identifies the line as Fe ii; 91 070 is the energy of the lower level in cm-1; 919 is the residual central intensity in per mil. The Xe ii line is identified by 54.01. |
The identification of the Xe ii lines and their consequent addition in the line lists, increases the accuracy of the synthetic spectra for the CP stars. In fact, it is important to be able to reproduce their high-resolution spectra well, because these stars are an excellent tool for extending laboratory spectrum analyses for several elements. An example is the determination of new high-excitation energy levels for Fe ii from the same UVES spectra of HR 6000 used for this paper (Castelli & Kurucz 2010). For instance, As ii is another element observed in some CP stars for which not even one log gf-value in the optical region has been found in the literature. As ii has not only been observed in 46 Aql (Sadakane et al. 2001; Castelli et al. 2009), but also in HD 71066, as we have shown in this paper. If only one log gf value were given for it, we could derive astrophysical log gf-values for the other lines, just as we did for Xe ii.
The abundance analysis of HD 71066 has pointed out the overabundances of Y ii, Nd iii, Dy iii, and Au ii for the first time, in addition to the Xe ii and As ii overabundances. Those of other elements, in particular Hg, P, Ti, Cr, Mn, Fe, and Sr, have already been stated by Thiam et al. (2010) and confirmed by us.
We found that HD 71066 is a typical HgMn star with Hg and Ca isotopic anomalies and emission lines for C i, Ti ii, Cr ii, and Mn ii. He i is underabundant and the shape of its profiles indicates the presence of helium vertical abundance stratification in the atmosphere.
Acknowledgments
Kutluay Yüce was supported by TÜBİTAK (The Scientific and Technological Research Council of Turkey). She thanks TÜBİTAK and Ankara University.
References
- Alvarez, E., Arnesen, A., Bengtson, A., et al. 1979, Phys. Scr., 20, 141 [Google Scholar]
- Ballester, P., Grosbol, P., Banse, K., et al. 2000, Proc. SPIE, 4010, 246 [NASA ADS] [CrossRef] [Google Scholar]
- Biémont, E., Palmeri, P., & Quinet, P. 1999, Ap&SS, 269, 635 [NASA ADS] [CrossRef] [Google Scholar]
- Boyce, J. C. 1936, Phys. Rev., 49, 730 [NASA ADS] [CrossRef] [Google Scholar]
- Castelli, F. 2005, Mem. Soc. Astron. It. Supp., 8, 44 [Google Scholar]
- Castelli, F., & Hubrig, S. 2004a, A&A, 425, 263 [NASA ADS] [CrossRef] [EDP Sciences] [Google Scholar]
- Castelli, F., & Hubrig, S. 2004b, A&A, 421, L1 [NASA ADS] [CrossRef] [EDP Sciences] [Google Scholar]
- Castelli, F., & Hubrig, S. 2007, A&A, 475, 1041 [NASA ADS] [CrossRef] [EDP Sciences] [Google Scholar]
- Castelli, F., & Kurucz, R. L. 2010, A&A, 520, A57 [NASA ADS] [CrossRef] [EDP Sciences] [Google Scholar]
- Castelli, F., Kurucz, R. L., & Hubrig, S. 2009, A&A, 508, 401 [NASA ADS] [CrossRef] [EDP Sciences] [Google Scholar]
- Cowley, C. R., Hubrig, S., Castelli, F., González, J. F., & Wolff, B. 2007, MNRAS, 377, 1579 [NASA ADS] [CrossRef] [Google Scholar]
- Djurovic, S., Pelaez, R. J., Cirisan, M., Aparicio, J. A., & Mar, S. 2006, J. Phys. B: At. Mol. Opt. Phys., 39, 2901 [NASA ADS] [CrossRef] [Google Scholar]
- Dolk, L., Wahlgren, G. M., & Hubrig, S. 2003, A&A, 402, 299 [NASA ADS] [CrossRef] [EDP Sciences] [Google Scholar]
- Dworetsky, M. M., Persaud, J. L., & Patel, K. 2008, MNRAS, 385, 1523 [NASA ADS] [CrossRef] [Google Scholar]
- Fuhr, J. R., & Wiese, W. L. 2006, J. Phys. Chem. Ref. Data, 35, 1669 [NASA ADS] [CrossRef] [Google Scholar]
- Gallagher, A. 1967, Phys. Rev., 157, 24 [NASA ADS] [CrossRef] [Google Scholar]
- Grevesse, N., & Sauval, A. J. 1998, Space Sci. Rev., 85, 161 [NASA ADS] [CrossRef] [Google Scholar]
- Hansen, J. E., & Persson, W. 1987, Phys. Scr., 36, 602 [NASA ADS] [CrossRef] [Google Scholar]
- Hauck, B., & Mermilliod, M. 1998, A&AS, 129, 431 [NASA ADS] [CrossRef] [EDP Sciences] [Google Scholar]
- Hubrig, S., Castelli, F., & Wahlgren, G. M. 1999, A&A, 346, 139 [NASA ADS] [Google Scholar]
- Hubrig, S., North, P., Schöller, M., & Mathys, G. 2006, Astron. Nachr., 327, 289 [NASA ADS] [CrossRef] [Google Scholar]
- Humphreys, C. J. 1939, J. Res. Natl. Bur. Stand. (US), 22, 19 [Google Scholar]
- Johansson, S. 2007, priv. comm. [Google Scholar]
- Kurucz, R. L. 1993, SYNTHE Spectrum Synthesis Programs and Line Data, CD-ROM, No. 18 [Google Scholar]
- Kurucz, R. L. 2005, Mem. Soc. Astron. It. Supp., 8, 14 [Google Scholar]
- Kurucz, R. L., & Peytremann, E. 1975, SAO Special Report, 362 [Google Scholar]
- Lanz, T., & Artru, M.-C. 1985, Phys. Scr., 32, 115 [Google Scholar]
- Miller, M. H., Roig, R. A., & Bengtson, R. D. 1971, Phys. Rev. A, 4, 1709 [NASA ADS] [CrossRef] [Google Scholar]
- Moon, T. T. 1985, Commun. Univ. London. Obs., 78 [Google Scholar]
- Nunez, N. E., Gonzalez, J. F., & Hubrig, S. 2010, Poster presented at the International Conference Magnetic Stars, 27 Aug.–1 Sept., 2010, Special Astrophysical Observatory, Zelenchukskaja, Russia [Google Scholar]
- Pickering, J. C., Thorne, A. P., & Perez, R. 2002, ApJS, 138, 247 [NASA ADS] [CrossRef] [Google Scholar]
- Popovic, L. C., & Dimitrijevic, M. S. 1996, A&AS, 116, 359 [CrossRef] [EDP Sciences] [Google Scholar]
- Reader, J., Corliss, C. H., Wiese, W. L., & Martin, G. A. 1980, Wavelengths and transition probabilities for atoms and atomic ions: Part 1. Wavelengths, part 2. Transition probabilities, NSRDS-NBS, 68 [Google Scholar]
- Rosberg, M., & Wyart, J.-F. 1997, Phys. Scr., 55, 690 [NASA ADS] [CrossRef] [Google Scholar]
- Sadakane, K., Takada-Hidai, M., Takeda, Y., et al. 2001, PASJ, 53, 1223 [Google Scholar]
- Saloman, E. B. 2004, J. Phys. Chem. Ref. Data, 33, 765 [NASA ADS] [CrossRef] [Google Scholar]
- Thiam, M., LeBlanc, F., Khalack, V., & Wade, G. A. 2010, MNRAS, 405, 1384 [NASA ADS] [Google Scholar]
- Zíelińska, S., Bratasz, Ł., & Dzierżȩga, K. 2002, Phys. Scr, 66, 454 [NASA ADS] [CrossRef] [Google Scholar]
Appendix A: The lines used for the abundance analysis of HD 71066
Abundances of HD 71066 from the ATLAS12 model with parameters Teff = 12 000 K, log g = 4.1.
Table A.1 lists the lines that were used to derive the abundances of HD 71066. The wording “not obs” is given for lines not present in the spectra, while the wordings “profile” and “blend” are given for lines observed well in the spectra, but that do not have measurable equivalent widths either because the noise affects the profile too much or because other components affect the line. These wordings also indicate lines for which adequate equivalent widths cannot be computed, as in the cases of Mg ii at 4481 Å which is a blend of transitions belonging to the same multiplet, of most Mn ii lines that are affected by hyperfine structure, of the Ca ii infrared triplet, which is a blend of isotopic components, and so on. For the remaining lines the measured equivelent widths are given in the table.
Appendix B: The investigated Xe ii lines in HR 6000, HD 71066, 46 Aql, and HD 175640
Table B.1 gives the details on the determination of the Xe ii wavelengths and log gf-values from the spectra of the four stars. It lists in successive columns the laboratory wavelengths and the line intensity taken from the NIST database (footnote 6), the stellar wavelengths as derived from HR 6000, HD 71066, 46 Aql, and HD 175640. If the observed wavelength is the same in all the stars, only that of HR 6000 is given. HR 6000, HD 71066, 46 Aql, and HD 175640 are indicated in Col. 6 with the numbers 1, 2, 3, and 4, respectively. A question mark means uncertain determinations from that star. The wavelength difference Δλ = λ(stellar)-λ(lab) is given in Col. 4. The energy and the configuration of the lower and upper level of the transition are given in Cols. 7–10, respectively. The last column adds some notes about the observed lines. Table B.1 lists also the NIST log gf-values and the log gf-values derived from the experimental transition rates determined by Zíelińska et al. (2002).
Xe II lines examined in HR 6000, HD 71066, 46 Aql, and HD 175640.
All Tables
The strongest emission lines in HD 71066, with the atomic data and configurations from the Kurucz website (see footnote 5).
Xenon abundance from the measured equivalent widths of HR 6000, 46 Aql, HD 71066, and HD 175640, for each star, using ATLAS12 models with parameters Teff and log g given in the table.
Abundances of HD 71066 from the ATLAS12 model with parameters Teff = 12 000 K, log g = 4.1.
All Figures
|
Fig. 1 Comparison of astrophysical log gf-values of Xe ii derived from HR 6000 with the log gf-values of the NIST critical compilation. |
| In the text | |
|
Fig. 2 Comparison of astrophysical log gf-values of Xe ii derived from HR 6000 with the astrophysical log gf-values derived from HD 71066. |
| In the text | |
|
Fig. 3 Comparison of astrophysical log gf-values of Xe ii derived from HR 6000 with the astrophysical log gf-values derived from 46 Aql. |
| In the text | |
|
Fig. 4 Comparison of astrophysical log gf-values of Xe ii derived from HR 6000 with the astrophysical log gf-values derived from HD 175640. |
| In the text | |
|
Fig. 5 Comparison for the four stars of the observed (black line) and computed (red line) spectra in the region of the Xe ii line with wavelength 446.2190 nm according to the NIST database (left panel) and with wavelength 446.2090 nm according to this paper (right panel). The line identification can be decoded as follows: for the first line, 898 last 3 digits of wavelength 446.0898 nm; 26 atomic number of iron; .01 charge/100; i.e., 26.01 identifies the line as Fe ii; 91 070 is the energy of the lower level in cm-1; 919 is the residual central intensity in per mil. The Xe ii line is identified by 54.01. |
| In the text | |
Current usage metrics show cumulative count of Article Views (full-text article views including HTML views, PDF and ePub downloads, according to the available data) and Abstracts Views on Vision4Press platform.
Data correspond to usage on the plateform after 2015. The current usage metrics is available 48-96 hours after online publication and is updated daily on week days.
Initial download of the metrics may take a while.