Free Access
Fig. 3
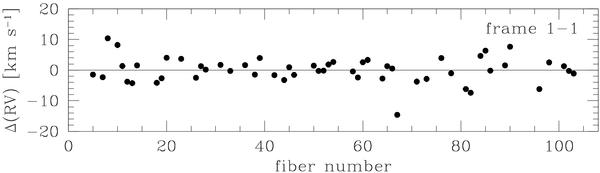
Difference between the RV measured in the first frame (frame 1-1 of Table 1) and the weighted average for each star, plotted as a function of the fiber number. Only the 53 brightest stars, with measurement uncertainty lower than 5 km s-1, are plotted.
Current usage metrics show cumulative count of Article Views (full-text article views including HTML views, PDF and ePub downloads, according to the available data) and Abstracts Views on Vision4Press platform.
Data correspond to usage on the plateform after 2015. The current usage metrics is available 48-96 hours after online publication and is updated daily on week days.
Initial download of the metrics may take a while.