Fig. 5
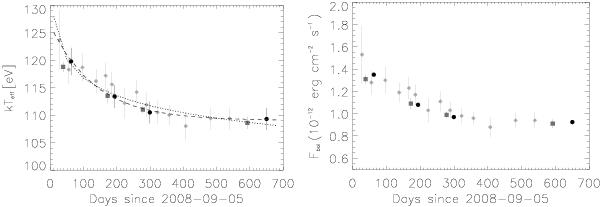
Decay of effective temperature (left panel) and thermal bolometric flux (right panel) with time for the XMM-Newton observations of EXO 0748−676. The dashed and dotted lines show the fit to a exponential function and a power law, respectively. The XMM-Newton, Chandra, and Swift points are represented by black circles, dark grey squares, and light grey diamonds, respectively. The XMM-Newton points are the values obtained for case 4 in Table 4. The Chandra and Swift points have been taken from Degenaar et al. (2011).
Current usage metrics show cumulative count of Article Views (full-text article views including HTML views, PDF and ePub downloads, according to the available data) and Abstracts Views on Vision4Press platform.
Data correspond to usage on the plateform after 2015. The current usage metrics is available 48-96 hours after online publication and is updated daily on week days.
Initial download of the metrics may take a while.