Fig. 4
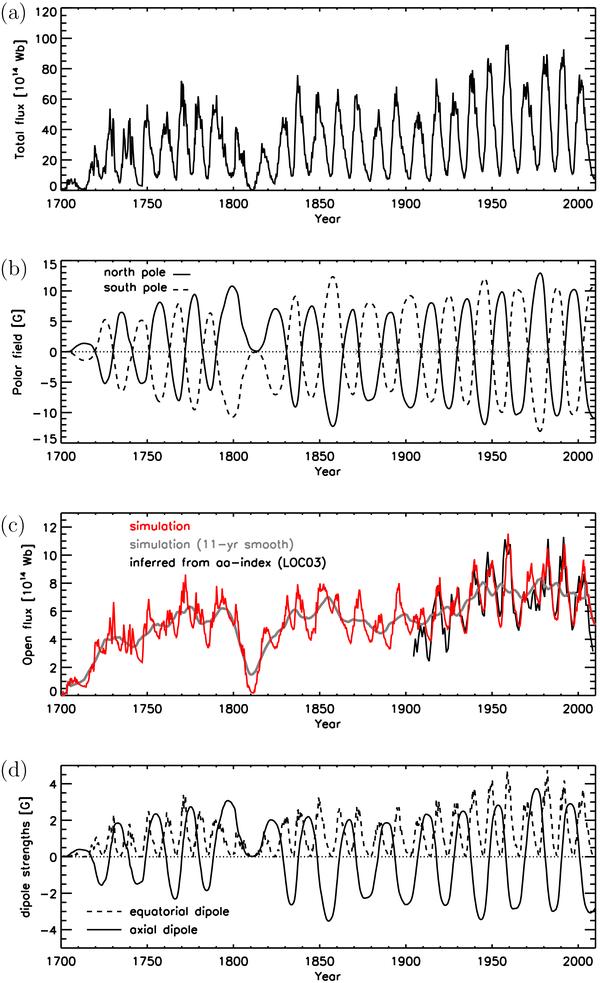
Reconstruction based on RG during 1700–2010. a) Total surface flux. b) Polar field. Solid and dashed curves are for the northern and southern hemisphere, respectively. c) Open heliospheric flux. The red curve gives the reconstruction, the grey curve is the 11-yr running average. The open flux as inferred from the geomagnetic aa index (Lockwood et al. 2009) is represented by the black curve. d) Axial (solid curve) and equatorial (dashed curve) dipole field strength.
Current usage metrics show cumulative count of Article Views (full-text article views including HTML views, PDF and ePub downloads, according to the available data) and Abstracts Views on Vision4Press platform.
Data correspond to usage on the plateform after 2015. The current usage metrics is available 48-96 hours after online publication and is updated daily on week days.
Initial download of the metrics may take a while.