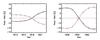
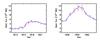
Fig. 13

The effect of the random component in generating the sources for the SFTM. The reconstructed polar field (upper panels) and open flux (lower panels) are shown for cycle 6 (left) and cycle 19 (right). The red vertical bars indicate the standard deviations corresponding to a set of twenty synthetic sunspot group records with different random numbers.
Current usage metrics show cumulative count of Article Views (full-text article views including HTML views, PDF and ePub downloads, according to the available data) and Abstracts Views on Vision4Press platform.
Data correspond to usage on the plateform after 2015. The current usage metrics is available 48-96 hours after online publication and is updated daily on week days.
Initial download of the metrics may take a while.