Fig. 12
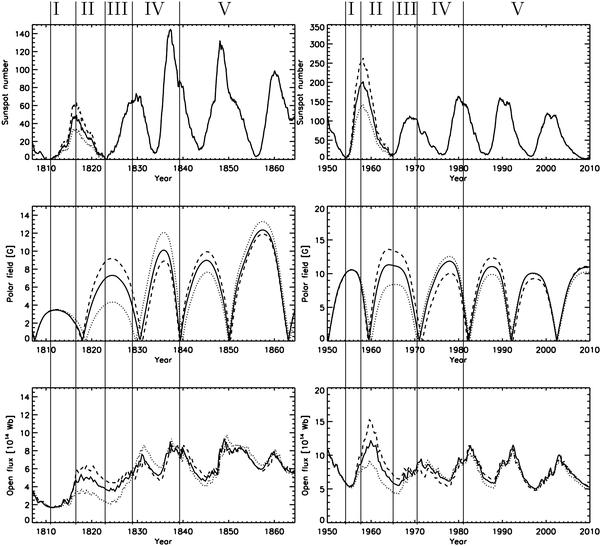
Effect of varying the sunspot number (upper panels) by an increase of 30% (dashed curves) and by a decrease of 30% (dotted curves) on the evolution of the polar field (middle panels, average absolute value of the northern and southern poles) and the open flux (lower panels). The weak cycle 6 (1810.6–1823.3, left panels) and the strong cycle 19 (1954.3–1964.9, right panels) of the RZ case are considered. The Roman numbers denote 5 time intervals which are affected by the variation of the sunspot numbers in different ways (see text).
Current usage metrics show cumulative count of Article Views (full-text article views including HTML views, PDF and ePub downloads, according to the available data) and Abstracts Views on Vision4Press platform.
Data correspond to usage on the plateform after 2015. The current usage metrics is available 48-96 hours after online publication and is updated daily on week days.
Initial download of the metrics may take a while.