Fig. 5
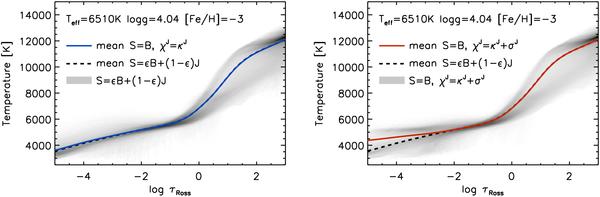
Left panel: temperature distribution with Rosseland optical depth from a representative snapshot of the [Fe/H] = −3 turnoff-star surface convection simulation computed solving the radiative transfer equation self-consistently for a source function with a coherent scattering term (standard case). Darker shades indicate higher probability. Blue curve: mean stratification from the corresponding simulation computed assuming a Planckian source function and no contribution of scattering to total extinction in optically thin layers. Right panel: corresponding temperature distribution with Rosseland optical depth from the simulation assuming a Planckian source function and scattering as true absorption everywhere (mean temperature stratification shown in red). Dashed lines (both panels): mean temperature stratification from the standard-case simulation. All snapshots were taken 80 min after the start of the simulations.
Current usage metrics show cumulative count of Article Views (full-text article views including HTML views, PDF and ePub downloads, according to the available data) and Abstracts Views on Vision4Press platform.
Data correspond to usage on the plateform after 2015. The current usage metrics is available 48-96 hours after online publication and is updated daily on week days.
Initial download of the metrics may take a while.