Fig. 4
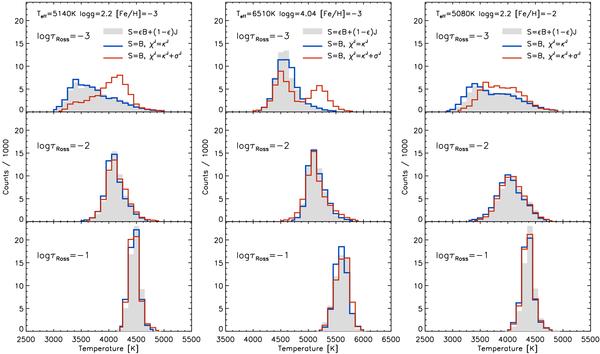
Histograms of temperature in the upper photospheric layers of the surface convection simulations at three different Rosseland optical depths and for the three different treatments of scattering in the radiative transfer solution. Left panel: results for the red giant at [Fe/H] = −3; central panel: turnoff star at [Fe/H] = −3; right panel: red giant at [Fe/H] = −2. The histograms are constructed from snapshots taken at the end of the simulation sequences, for the coherent scattering case (grey bars), Planckian source function and no scattering extinction in optically thin layers (blue curves), and Planckian source function with scattering treated as true absorption (red curves).
Current usage metrics show cumulative count of Article Views (full-text article views including HTML views, PDF and ePub downloads, according to the available data) and Abstracts Views on Vision4Press platform.
Data correspond to usage on the plateform after 2015. The current usage metrics is available 48-96 hours after online publication and is updated daily on week days.
Initial download of the metrics may take a while.