Fig. 2
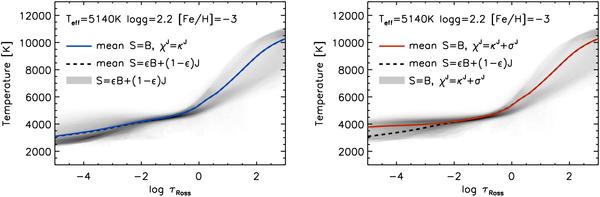
Grey shaded areas: distribution of temperature as a function of Rosseland optical depth in two representative snapshots of two surface convection simulations of a metal-poor red giant at [Fe/H] = −3. The snapshots were taken 28 h after the start of the simulations. Darker shades indicate temperature values with higher frequency of occurrence. Left panel: temperature distribution from the simulation with self-consistent solution of the radiative transfer equation for a source function with a coherent scattering term (standard case). Continuous blue line: mean temperature stratification from the corresponding simulation assuming a Planckian source function and neglecting the contribution of scattering in optically thin layers, averaged over time and surfaces of constant Rosseland optical depth. Right panel: temperature distribution for the radiative transfer solution assuming a Planckian source function and treating scattering as true absorption everywhere. Continuous red line: corresponding mean temperature stratification. Dashed lines (both panels): mean temperature stratification for the standard-case simulation.
Current usage metrics show cumulative count of Article Views (full-text article views including HTML views, PDF and ePub downloads, according to the available data) and Abstracts Views on Vision4Press platform.
Data correspond to usage on the plateform after 2015. The current usage metrics is available 48-96 hours after online publication and is updated daily on week days.
Initial download of the metrics may take a while.