Fig. 10
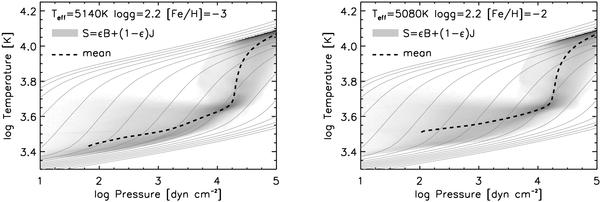
Grey shaded area: distribution of temperature versus gas pressure in two representative snapshots of metal-poor red giant surface convection simulations at [Fe/H] = −3 (left panel) and [Fe/H] = −2 (right panel). The simulations were computed with the radiative transfer solver for the coherent scattering case. Darker shades indicate higher frequency of occurrence. Dashed lines: mean stratifications, averaged over time and surfaces of constant Rosseland optical depth. Thin grey lines: contours of constant entropy.
Current usage metrics show cumulative count of Article Views (full-text article views including HTML views, PDF and ePub downloads, according to the available data) and Abstracts Views on Vision4Press platform.
Data correspond to usage on the plateform after 2015. The current usage metrics is available 48-96 hours after online publication and is updated daily on week days.
Initial download of the metrics may take a while.