| Issue |
A&A
Volume 528, April 2011
|
|
|---|---|---|
| Article Number | A139 | |
| Number of page(s) | 11 | |
| Section | The Sun | |
| DOI | https://doi.org/10.1051/0004-6361/201016106 | |
| Published online | 16 March 2011 | |
The EUV spectrum of the Sun: SOHO CDS NIS irradiances from 1998 until 2010
1 DAMTP, Centre for Mathematical
Sciences, University of Cambridge, Wilberforce Road, Cambridge CB3
0WA, UK
e-mail: This email address is being protected from spambots. You need JavaScript enabled to view it.
2 INAF – Osservatorio Astronomico di
Capodimonte, Salita Moiariello, 16, 80131
Napoli,
Italy
Received: 9 November 2010
Accepted: 7 February 2011
Abstract
We present extreme-ultraviolet (EUV) irradiances of the Sun taken during the 1998–2010 period from the Solar and Heliospheric Observatory (SoHO) Coronal Diagnostic Spectrometer (CDS) Normal Incidence Spectrograph (NIS). They were obtained from NIS full-Sun radiance observations, and represent the first set of EUV spectral observations spanning a solar cycle. We compare the CDS line irradiances with those obtained from rocket measurements, one that flew in May 1997 and one in April 2008, together with the Thermosphere Ionosphere Mesosphere Energetics Dynamics (TIMED) Solar EUV Experiment (SEE) EUV Grating Spectrograph (EGS) and various historical records. Excellent agreement (to within a relative 20%) is found in most cases, with a few notable exceptions. Lines formed in the transition region show very small changes with the solar cycle, with the exception of the helium lines. The irradiances of lines formed around 1 MK already change during the cycle by a factor ~5; for hotter lines (2.5 MK) the variability reaches factors of the order of 40. For lines formed around 1–3 MK, and to a less extent, the helium lines, we find a good linear correlation between CDS irradiances and the 10.7 cm radio flux, although each line has a different coefficient. No correlation is found for the transition-region lines. Significant discrepancies between the observed irradiances and those modelled is found. This confirms the importance in obtaining EUV spectral measurements of the solar irradiance.
Key words: Sun: corona / techniques: spectroscopic
© ESO, 2011
1. Introduction
The importance of studying the extreme-ultraviolet (EUV: 150–1200 Å) solar irradiance is twofold: the study of the Sun-as-a-star, as a key to interpret EUV emission from similar stars, and the effect of the solar EUV radiation on the Earth system. The study of the EUV solar irradiance is in fact the study of the emission from a star for which we also have detailed information about the distribution of the sources on its surface. Thus far, studies in this direction have been carried out only in the X-ray range using broad-band filter observations (e.g. Orlando et al. 2004). Some effects of the EUV radiation on Earth’s atmosphere – particularly on the thermosphere – are well known. More subtle effects on the Earth system, perhaps on the climate, are currently debated. Some recent results (Meehl et al. 2009) seem to hint that even the very small amount of variation along the activity cycle of the solar energy output (of the order of 0.1%) can produce significant effects on some local climate patterns. The far-ultraviolet (FUV: 1200–2000 Å) and EUV radiation, although only a small fraction of the total solar output, display variations of much larger amplitude as the magnetic activity of the Sun varies across its 11-year cycle. Whether and how such large variations can produce some effect – however small – on Earth’s climate is still unclear (Lean et al. 1995; Haigh 1996; Priest et al. 2007; Foukal et al. 2009).
Despite the importance of the EUV solar irradiance, few measurements have been available. Most were taken from sounding rockets, and thus give only a snapshot of the solar irradiance. Therefore, all studies on the solar irradiance and its effects, for example, on the Earth’s atmosphere are based on proxies. Such an approach, of course, adds an additional layer of complexity and uncertainty to those studies. Hence the need for direct, reliable measurements of the solar EUV, spectrally resolved irradiance.
As part of a programme of studying the EUV spectral radiance and its variation over the cycle, we have done over the past few years a full analysis of the performance of the Solar and Heliospheric Observatory (SoHO) Coronal Diagnostics Spectrometer (CDS; Harrison et al. 1995), and performed various comparisons. The results of the calibration work concerning the SOHO CDS Grazing Incidence Spectrograph (GIS) were published in Kuin & Del Zanna (2007), while those for the Normal Incidence Spectrograph (NIS) are summarised in Del Zanna et al. (2010; hereafter Paper I).
The NASA Thermosphere Ionosphere Mesosphere Energetics Dynamics (TIMED) Solar EUV Experiment (SEE) EUV Grating Spectrograph (EGS) (Woods et al. 2005a) has provided some irradiance measurements since 2002. The main drawback of the TIMED SEE EGS experiment has been the poor spectral resolution (as most previous instruments). The full-width-half-maximum (FWHM) of the lines at the NIS wavelengths is 3 Å, compared to values of about 0.6 Å for NIS. A prototype of the Solar Dynamics Observatory (SDO) Extreme ultraviolet Variability Experiment (EVE) instrument (hereafter PEVE) was flown on 2008 April 14. It provided an excellent EUV spectrum (Woods et al. 2009; Chamberlin et al. 2009) with a resolution close to that of NIS (0.9 Å FWHM, see Paper I for a comparison of the spectra). The instrument was radiometrically calibrated on the ground (Chamberlin et al. 2007; Hock et al. 2010). A preliminary comparison between the CDS and PEVE irradiances was presented in Paper I.
The SDO satellite was launched in 2010. The SDO EVE instrument includes two spectrographs and multiple photometers for measuring the solar EUV irradiance from 1 to 1220 Å (Woods et al. 2006). It started routine operations on 2010 May 1. The EVE spectra are from the Multiple EUV Grating Spectrographs (MEGS) and have 1 Å spectral resolution. The MEGS A channel is a grazing incidence spectrograph for the 50–380 Å range, and the MEGS B channel is a double-pass normal incidence spectrograph for the 350–1050 Å range. Work is in progress to refine the flight EVE calibration using further sounding rocket flights.
SOHO on the other hand has been observing the Sun in the EUV since 1996. The Charge, Element, and Isotope Analysis System (CELIAS) Solar EUV Monitor (SEM) (Hovestadt et al. 1995) measurements do not provide irradiances, but rather count rates in two wide broad-bands. A conversion into irradiances needs an accurate knowledge of how the spectral irradiance changes along the cycle, something which requires some modelling and is therefore subject to added uncertainties. During solar minimum conditions in 1996, the SOHO Solar Ultraviolet Measurements of Emitted Radiation (SUMER, Wilhelm et al. 1995) made some full-Sun scans (Wilhelm et al. 1998), and provided a few irradiance measurements. From 1996, CDS has been routinely recording EUV radiances. With a few minor gaps, CDS covers the important 150–800 Å EUV spectral range, of which the 308–379 and 513–633 Å are covered at first order by the two NIS spectral channels (NIS 1 and 2, respectively), observed at a spectral resolution of about ~0.5 Å or better. Therefore, compared with TIMED and SDO measurements, the CDS spectrometer provides the almost full coverage of the past solar activity cycle with a better spectral resolution, although with a smaller wavelength coverage (still sufficient for a good coverage of transition-region (TR) and coronal temperatures).
Radiance measurements over the whole Sun were taken quite regularly once a month or so starting in 1998 (when the Sun was already significantly more active) with the CDS NIS study USUN. In this paper, we present the NIS spectral irradiance measurements obtained between 1998 and 2010 adopting the calibration described in Paper I. Preliminary results were published in Del Zanna et al. (2005); Del Zanna & Andretta (2006, 2010). A further paper (Paper III) will analyse the radiance measurements, and study how different regions of the Sun contribute to the irradiance.
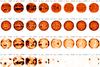 |
Fig. 1 CDS (negative) radiances from (top to bottom) He i, O v (~0.25 MK), Mg x (~1 MK), Fe xvi (~2.5 MK), from the beginning of cycle 23, to the current extended minimum. Images are on linear intensity scales. The radiances of each line are displayed with the same scale for the entire period. |
2. Data analysis
2.1. The CDS NIS USUN radiance observations
The CDS USUN study consists of 69 rasters, for a total of 700 to 1000 exposures with the 4″ slit, covering the whole Sun (with some off-limb coverage) in about 13 h (see, e.g., Thompson & Brekke 2000, for details). The movement of the field-of-view (FOV) of the slit is done by a mirror. For this study, the movement is “sparse” in the sense that the 4″ FOV of the slit is moved in steps (24″) larger than its width. The total radiance of the Sun is therefore sub-sampled by about a factor of 6. Here, we only consider the observations USUN_6 version 2, where exposures are binned on board (to a resolution of 13″) along the slit. This is done to increase the count rates and reduce the telemetry load. The first of such studies was run on 1998 April 23. There are some previous studies where the entire spectra along the slit were summed on-board (this includes the study for the 1997 May 15 cross-calibration with the EGS sounding rocket), but they are strongly affected by cosmic rays.
A large fraction of the USUN_6 version 2 observations are not presented here for a variety of reasons. First, many observations had missing rasters or exposures. Then, many observations during the last solar maximum were done on days when flares occurred. These have been avoided.
We applied standard processing for the de-biasing and flat-fielding, using the CDS routine VDS_CALIB. Cosmic ray hits strongly constrain NIS observations, in the sense that exposure times cannot be too long. Cosmic ray hits were removed from the subsequent analysis. Because the standard SolarSoft software does not correctly take data binning into account, we used specially-written software for detecting and removing cosmic rays hits. Many geometrical distortions of the NIS spectra are present (see, e.g., Haugan 1999). The main one is the slant in the spectra, i.e. that the dispersion direction is not parallel to the CCD rows. This was corrected by the CDS routine VDS_ROTATE.
NIS spectra contain a scattered light (“background”) component, which is mostly concentrated in the network areas, but disappears in off-limb observations. It was therefore believed that most of this scattered light comes from the H i Lyα; however, this “background” is fairly constant in wavelength, and has similar values in the two NIS channels. The NIS 1 is affected by additional “background” components at the shortest wavelengths. This background component is subtracted from the narrow-slit spectra when measuring the line radiances with a fitting procedure.
The temporary loss of contact with SOHO in June 1998 permanently damaged the performance of some of its instruments. The spacecraft was successfully recovered in September 1998. The spectral resolution in terms of full-width at half-maximum (FWHM) was ≃ 0.35 Å for NIS 1 and ≃ 0.5 Å for NIS 2 before the SOHO loss of contact. All the lines in the spectra were fitted with simple Gaussian profiles, in the case of data prior the loss of contact of SOHO (two USUN studies), and with properly broadened, asymmetric profiles afterwards (Thompson 1999). The fitting in the NIS channels was done on the spectra in photon-events, where the scattered light component is relatively constant.
We used custom-written software to construct a mosaic of the rasters to check for pointing accuracy. We found some instances where the pointing was incorrect, but not by much. We then linearly interpolated the spectra line radiances in the spatial domain, and divided the counts by the exposure times, by the pixel areas and by the mirror-dependent effective areas.
We then applied corrections for the long-term drop in responsivity. We have followed the analysis described in Paper I using the monitoring NIMCP study, and added one year of observations to obtain new long-term corrections, which have been adopted here. These are practically the same as those in Paper I, with the exception of the 2009–2010 period, due to the fact that the drop in responsivity has levelled in the last two years. We would like to point out that the use of the standard CDS calibration, which has been in use until 2010, under- and over-estimates the NIS radiances by large (up to 3) factors.
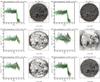 |
Fig. 2 The estimation of the off-limb contribution to the total irradiance for a selection of lines: the “chromospheric” He i 584 Å, the transition-region (~0.25 MK) O v 630 Å, the “coronal” (~1 MK) Mg x 625 Å, and the “hot” (~2.5 MK) Fe xvi 361 Å, in addition to the two second-order lines Si xi 303 Å and He ii 304 Å. Images are negative. The solar images and the histograms are displayed in logarithmic scales. |
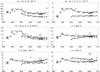 |
Fig. 3 CDS irradiances (boxes) for chromospheric and lower-transition region lines at 1 AU (108 phot cm-2 s-1). The CDS irradiances are compared with the CDS/ rocket EGS measurements of May 1997 by Brekke et al. (2000) [asterisks], the TIMED SEE EGS [triangles] and the SDO/EVE prototype spectrum of 2008 April 14 [diamond]. |
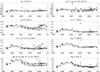 |
Fig. 4 CDS irradiances (boxes, 108 phot cm-2 s-1) for upper-transition region lines. The CDS irradiances are compared with other datasets as in Fig. 3. |
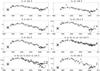 |
Fig. 5 CDS irradiances (boxes, 108 phot cm-2 s-1) for higher-temperature lines. The CDS irradiances are compared with other datasets as in Fig. 3. |
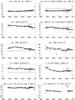 |
Fig. 6 Ratios (photon units) of SOHO/NIS EUV irradiances in lines from He and other ions which should be approximately constant with the solar cycle. The dashed lines correspond to the values from the averaged Skylab ATM radiances in the quiet Sun, while the diamond refer to the SDO/EVE prototype spectrum of 2008 April 14. The full line indicates the irradiance ratios from the Heroux et al. (1974) measurements. |
Finally, we applied the Del Zanna et al. (2001) responsivities, scaled as described in Paper I. Del Zanna et al. (2001) obtained a radiometric calibration between all the first and second order lines by studying line ratios in a large number of observations. The calibration was relative to the responsivity at 584 Å found by Brekke et al. (2000). On May 15, 1997, a NASA/Laboratory for Atmospheric and Space Physics (LASP) rocket carried an EUV Grating Spectrograph (EGS) that had been calibrated against synchrotron emission. The Sun was close to solar minimum conditions. The spectrum had a low resolution but allowed the measurement of the NIS responsivities at a few wavelengths, as described in Brekke et al. (2000). We also applied corrections that take into account the SOHO distance to the Sun, so the final irradiances are at 1 AU.
Sample radiances in a few lines are shown in Fig. 1. That figure clearly shows how dramatic the effect of active regions is in the hot lines, and how quiet the Sun has been in the last few years.
The NIS rasters do not observe the whole off-limb corona to great distances. We therefore studied the off-limb behaviour of all the lines in the NIS spectra, to estimate the off-limb contribution that was not observed with the USUN study. For each line, we estimated the median radiance as function of distance from disk center; we then fitted those median radiances above the limb with an exponential. The fitting procedure is illustrated in Fig. 2, where we show, to the left of each radiance image, the corresponding two-dimensional histogram of radiance vs. heliocentric distance. The median and the standard deviation of the radiance distribution are plotted as a function of distance. The weighted exponential fit, extrapolated to 1.6 RSun, is also shown.
We then padded the radiance images to cover a FOV of ± 1.6RSun, filling the extra pixels with the off-limb radiances estimated with the fitted exponential, and we calculated the irradiances by summing up all contributions within 1.6 solar radii. We found that for practically all the lines in the NIS ranges, the estimated correction to the observed USUN irradiance is negligible beyond 1.6 solar radii, usually converging to a constant value much below that distance. The extrapolation procedure could of course be improved, for instance by distinguishing between polar and equatorial regions. Also, the exponential is a good approximation only for hotter lines. For cooler lines, the approximation is less good. However, as indicated by the examples shown in Fig. 2, the estimated off-limb contribution not observed by the USUN rasters is of the order of ~10% for the hottest lines, dropping much below to 1% for the TR lines, and thus more sophisticated procedures are hardly justified.
A selection of lines in the CDS NIS spectral range.
2.2. TIMED SEE EGS, prototype and flight EVE
Three EGS sounding rocket flights were flown on 2002 February 8, 2003 August 12, 2004 October 15 for the TIMED SEE EGS calibration. Each sounding rocket was radiometrically calibrated on the ground. The final calibration flight for the TIMED SEE EGS was flown on 2008 April 14, carrying the PEVE instrument.
Whilst carrying the CDS calibration, we have compared over the years the CDS irradiances with those obtained from the TIMED SEE EGS, encountering significant discrepancies in a number of cases. The SEE calibration version 10 (adopted here and available since July 2009) significantly improved the comparison for many wavelengths. Version 10 changed significantly in the 70–270 Å range as the spectral model used in interpolating the TIMED SEE XUV Photometer System (XPS) data was changed, whilst at longer wavelengths the updates (less than 25%) were mainly due to an improved degradation function for the 2006–2009 period (cf. Woods et al. 2008, and http://lasp.colorado.edu/see/ for details). The TIMED SEE calibration provides a relative 20% accuracy at most wavelengths in the 450 to 1900 Å range. The sensitivity of the EGS falls off sharply below 450 Å and thus the relative uncertainty is about 50% in the 270–450 Å range (Woods et al. 2005b).
We have obtained the TIMED SEE EGS daily-averaged spectral line irradiances from the file: “see_egs_L2_merged_2010163_010.ncdf”1. We computed line irradiances by fitting Gaussian profiles in a few selected spectral ranges and by subtracting a linear background.
A selection of PEVE irradiances is listed in Table 1 of Paper I. The fit for the He ii 304 Å line has been redone, providing 60 × 108 phot cm-2 s-1. Although the flight EVE calibration is still ongoing, we have surveyed the first two months of data, and selected 2010 May 25 as an early date when the Sun was relatively quiet, with only some small active regions. We analysed the level 1 EVE data and found an He ii 304 Å irradiance of 54 × 108 phot cm-2 s-1, i.e. only 10% lower than PEVE. The small active regions produced a significant increase in the irradiances of the hotter coronal lines, so the PEVE spectrum is more representative of true solar minimum conditions.
3. Results
The resulting irradiances in a selection of EUV lines are shown in Figs. 3–5, [boxes] with the values obtained from the EVE prototype (diamonds) and those from the CDS measurements of May 1997 by Brekke et al. (2000) [asterisks]. For a meaningful comparison with the irradiances measured by TIMED/SEE EGS and by the EVE prototype, we have summed all the main CDS/NIS lines contributing to those observed (at the lower resolution) by TIMED SEE EGS and PEVE. We have done the same with the CDS measurements of May 1997. A selection of lines, observed by CDS, PEVE and TIMED SEE EGS are listed in Table 1, which also provides the observed wavelengths. The same Table indicates which of the lines spectrally resolved by CDS are blended in the PEVE and TIMED SEE EGS spectra.
Figure 6 shows a selection of ratios which are expected to be approximately constant with the solar cycle. Indeed, despite some scatter, most of the ratios are relatively constant. This is an independent check on the goodness of the long-term calibration. We would like to point out that if the previous CDS long-term corrections were used, very different results would be obtained.
Historical records of irradiance measurements.
3.1. Previous records in the EUV
We have surveyed the literature for accurate EUV irradiance measurements at the CDS wavelengths. There are very few datasets, mostly from sounding rocket flights, of which most had a poor resolution. We list the most relevant dates in Table 2, and display a few line irradiances in Table 3. Measurements from some historical sources (e.g. Heroux et al. 1974) are remarkably close to the CDS ones, however there is a large scatter, which is not just due to solar variability. It has been noted in the past that a correlation between the 10.7 cm radio flux and the irradiances of a few lines exist. For example, Timothy & Timothy (1970) showed a correlation (although not linear) with the strong He ii 304 Å line. Similar correlations are present in various datasets, however when all the historical absolute measurements are considered, this correlation tends to disappear. We therefore believe that this large scatter is mostly due to poor instrument calibrations. Some measurements are well known to have problems. For example, the Orbiting Solar Observatory OSO 3 measurements of Hall & Hinteregger (1970) are at odds with all the other ones. Various authors (see, e.g. Heroux et al. 1974; Timothy 1977) attribute the discrepancies to an incorrect calibration, so these data are not displayed here. The second-order measurement from Freeman & Jones (1970) are also at odds with all other measurements and have been discarded here.
The best calibrated spectrum in the EUV is undoubtedly that one of Malinovsky & Heroux (1973) with typical uncertainties of 10% or so for lines close in wavelength. The Heroux et al. (1974) spectrum is also excellent and has a stated accuracy of 30% over a broad wavelength range. Spectra of similar accuracy are those of Higgins (1976) and Heroux & Higgins (1977). The Heroux et al. (1974) irradiances are in excellent agreement with our CDS measurements taken when the radio flux was at similar levels.
A few measurements from the SOHO/SUMER instrument (in second order) are also available, see Table 4. Wilhelm et al. (1998) report SOHO/SUMER irradiances during the previous solar minimum in 1996. They were obtained from full Sun spectral scans similar to the CDS ones. Further measurements were obtained by Dammasch et al. (1999), although line profiles were not obtained in that case, and large discrepancies with the Wilhelm et al. (1998) results were found. The Wilhelm et al. (1998) represent the most accurate SOHO/SUMER results. Relative uncertainties in the SUMER calibration for data taken before June 1998 are 15%.
3.2. Proxies
Given the lack, until the launch of SDO/EVE, of complete and continuous measurements of the EUV irradiance, there is ample literature on the subject of modelling it using various proxies of solar activity. One of the most common one is the 10.7 cm radio flux. Throughout this paper, we have adopted the daily measurements2 of the integrated emission from the solar disc at 2800 MHz (10.7 cm), scaled to 1 AU, made by the National Research Council of Canada (at the Algonquin Radio Observatory, near Ottawa until 1991 and at the Dominion Radio Astrophysical Observatory, near Penticton, British Columbia).
We defer a detailed discussion on proxies to a future paper, after a proper analysis of the variations of the distribution of spectral line radiances along the solar cycle, which is done in Paper III. This is because we believe that any proper modelling of the EUV irradiances should take into account our understanding of how radiances in different lines vary, in particular in active regions, which are affecting the changes in the irradiances during solar maximum. This is a complex matter.
Here, we just like to point out that a simple correlation between all CDS line irradiances and a proxy such as the F10.7 does not exist. One example is shown in Fig. 8, where the daily 10.7 cm radio fluxes are compared to the SOHO/CDS irradiances for a selection of lines formed over largely different temperatures. Individually, the hotter lines show a good correlation, although each has a different linear coefficient. On the contrary, there is no correlation with all the lines formed at transition region temperatures. We would like to point out that the degree of correlation does not improve if e.g. the square root of F10.7 is used or if the irradiances are scaled relative to a specific point in time such as solar cycle minimum (cf. Woods et al. 2000). The helium lines are a special case, perhaps because of the role the EUV coronal radiation could play in their formation (cf. references in Andretta et al. 2003).
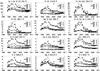 |
Fig. 7 CDS irradiances (108 phot cm-2 s-1), compared with modelled ones. HEUVAC: Richards et al. (2006); SIP: Tobiska et al. (2008); H81: Hinteregger et al. (1981). |
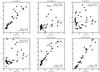 |
Fig. 8 Correlation between SOHO/CDS irradiances (F) and daily 10.7 cm radio fluxes (10-22 W m-2 Hz-1). |
3.3. Comparison with modelled irradiances
It is interesting to compare the CDS measurements with the values that are predicted by various models. Many of the models used in Earths upper atmosphere research are based on EUV irradiances from sounding rockets or the TIMED SEE EGS, modified to take into account the solar variability using a proxy, often the 10.7 cm radio flux. Most models provide estimates at 10 Å resolution, which is not suitable for a direct comparison with the CDS line irradiances. Here we have selected the HEUVAC model (Richards et al. 2006), the SIP model (previously-known as SOLAR2000) of Tobiska et al. (2008)3, and the older H81 of Hinteregger et al. (1981). For the HEUVAC and H81 models, we adopted the programs as available at LASP4. Both the HEUVAC and H81 models adopt as input the 10.7 cm radio flux. The comparison between observed (CDS) and modelled irradiances (for the same dates) is shown in Fig. 7.
There are clear, large discrepancies between the measured and predicted irradiances in a number of lines, not just in the absolute values, but also in the cycle variations. All the models over-predict the cycle variation of the transition-region lines. There is no increase in the predicted irradiances after 2009. Of all the models, the HEUVAC is that one which overall shows better agreement.
SOHO/SUMER irradiances.
3.4. Discussion
Let us start discussing the irradiance measurements considering the strongest lines first. The strongest line in the CDS spectra is the He i 584 Å line. We recall that the Del Zanna et al. (2001) radiometric calibration adopted the 584 Å responsivity of Brekke et al. (2000), obtained from a comparison between CDS irradiances and those from a rocket flown on 1997 May 15. Our CDS irradiances during minimum conditions are in excellent agreement with the SOHO/SUMER measurements (Wilhelm et al. 1998) at solar minimum in 1996, and with all the well-calibrated previous measurements, in particular those of Heroux et al. (1974) (taken at similar activity). The TIMED/EGS version 10 irradiances are slightly lower, whilst the PEVE value is about 30% higher, and is at odds with the 1997 May 15 EGS rocket, considering that solar activity was higher in 1997.
The strongest line in the EUV is the He ii 304 Å line, observed in second order with SOHO/CDS. There are clear discrepancies between the CDS, the TIMED SEE EGS and the PEVE irradiances (cf. Paper I), with the CDS irradiances larger by about 50% and the TIMED SEE EGS much lower. The low TIMED SEE EGS values are now considered incorrect, and caused by a scattered light issue for the 270–400 Å range (Woods, priv. comm.).
The CDS irradiances obtained with the Del Zanna et al. (2001) responsivities are in agreement with those obtained by Brekke et al. (2000) with the EGS sounding rocket flown on 1997 May 15, and with various radiance measurements. For example, the Skylab Apollo Telescope Mount (ATM) values, the Solar Extreme-Ultraviolet Rocket Telescope and Spectrograph (SERTS) (see, e.g. Thomas 2002) and the EUV Normal-Incidence Spectrometer (EUNIS) (see, e.g. Jordan & Brosius 2007, and references therein).
The He lines have negligible limb-brightening and off-limb contribution (cf. Fig. 2), so it is straightforward to convert radiance measurements into irradiances, at least for the quiet Sun.
It has been known for a long time (see, e.g. Andretta & Jones 1997) that the ratio of the He ii 304 Å and He i 584 Å lines is relatively constant, independently of the region observed. Indeed this is observed in Fig. 6. The Skylab ATM quiet Sun measurements from Vernazza & Reeves (1978) indicate a ratio of 7.8 in photon units, shown with a dashed line in Fig. 6. The Skylab ATM measurements did not resolve the Si xi 303.3 Å from the He ii 304 Å. Heroux et al. (1974) measured a ratio of 4.96 for the (Si xi + He ii)/He i 584 Å ratio, shown with a line in Fig. 6. This value is close to the PEVE measurement (4.2). The Si xi contribution is small, indeed the Heroux et al. (1974) He ii 304 Å/He i 584 Å ratio is 4.90 (photons).
We suggest that the Skylab ATM, the SERTS and EUNIS radiances of the He ii line in the quiet Sun were overestimated. The same for the irradiance of the EGS rocket flown on 1997 May 15. We adopt here a correction factor of 1.5 to the Del Zanna et al. (2001) NIS responsivity in second order (1.36 × 10⁻⁵ events/photon, in turn corrected in Paper I for the small long-term decrease). This results in a responsivity at 607.6 Å of 2.12 × 10⁻⁵ events/photon. For comparison, Brekke et al. (2000) measured 1.64 × 10⁻⁵ events/photon, while the SERTS-97 provided a similar value (1.68, Thomas, priv. comm.). The new responsivity brings the He ii 304 Å/He i 584 Å ratio into agreement with the Heroux et al. (1974) measurements (see Fig. 6), and the He ii 304 Å irradiances into agreement with PEVE.
Incidentally, the absolute value of the radiances of He i and He ii resonance lines measured with CDS was used by Andretta et al. (2003) to constrain the formation mechanism of those lines. The responsivity adopted in that paper (1.56 × 10⁻⁵ events/photon) was larger than the value of Del Zanna et al. (2001), but still smaller than the value adopted here. Adopting the latter value would not change the basic results of that work, although the outcome of the test would become less stringent.
Regardless of their absolute values, the CDS irradiances clearly show how strong an effect active regions have on the He ii and He i, given the large increase during solar maximum conditions. Indeed, there is some correlation with the radio flux at 10.7 cm, as Fig. 8 shows.
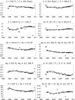 |
Fig. 9 Ratios (photon units) of SOHO/NIS EUV irradiances in a selection of lines. |
It is remarkable that transition-region lines do not show the same trend, indeed the presence of active regions has very little effect on their irradiances. This is clearly seen in the radiances shown in Fig. 1: unlike the hotter and the helium lines, changes in the radiances are not large. More details on how the distribution of radiances changes are presented in Paper III. This is the first time that is clearly seen. It is also interesting to notice that all the transition region lines show the same behaviour, indeed the CDS irradiance ratios of e.g. O iii, O iv, O v lines are fairly constant (see Fig. 9). This result is also present in TIMED SEE EGS and historical data. Indeed, considering the stronger lines, from O iii, O iv, O v, we find (see Fig. 3) good agreement (within 20%) with the TIMED SEE EGS data and with the previous well-calibrated irradiance measurements (cf. Table 3). The agreement between the CDS and TIMED SEE EGS irradiances in the O iii 600 Å line suggests that the EGS second-order correction problems near 608 Å (cf. SEE Version 10 release notes) are not affecting much the irradiance at 600 Å. The PEVE results are slightly higher, in particular for the O v 630 Å, which, as already noted in Paper I, is significantly higher. The PEVE irradiance is at odds with the EGS rocket flown on 1997 May 15 (Brekke et al. 2000), with the SOHO/SUMER measurements of Wilhelm et al. (1998) and with many values found in the literature (although a large scatter is present).
For other transition-region lines (see Fig. 4), good agreement (within 20%) is found between our CDS and the TIMED/EGS and PEVE results. Lines formed just below 1 MK as Ca x and Mg ix start to show a solar cycle variation due to the effects of the active regions. These variations increase significantly in lines formed over progressively higher temperatures, as Fig. 5 clearly show. Here again, good agreement is found between the CDS and the TIMED/EGS and PEVE measurements, in particular for the stronger lines. Lines formed above 1 MK present a large increase during solar maximum in 2001–2002, and a minimum in 2008–2009. Irradiances after 2009 have increased, but are still much lower than those around the previous maximum.
Finally, a consideration about the usefulness of the CDS Sun-as-a-star measurements. These observations allow to measure global characteristics of the solar atmosphere which can be directly compared with observations of other stars. One example is given in Fig. 9, where some diagnostic ratios are plotted. The plots show the ratios of the irradiances in successive ionization stages of the same element, and provide an indication of possible temperature variations. It is clear that the middle of the transition region does not show significant variations. On the other hand, the global temperature for plasma around 1 MK and above does change with the solar cycle. Further discussion on this will be presented in Paper III. The bottom 2 plots in Fig. 9 show ratios that are only slightly sensitive to temperature variations, but are from different elements, i.e. can be used to study element abundance variations. The Ne vii vs. Mg vii plot for example indicates that little (if any) variations of the Ne/Mg abundance in the transition region were present during the last solar cycle.
4. Conclusions
We have provided a consistent set of CDS NIS EUV irradiances over the 1998–2010 period adopting the long-term corrections of Paper I and the Del Zanna et al. (2001) responsivities (with the small corrections described in Paper I, and the exception of the He ii 304 Å). We found good agreement (to within 20%) between the NIS irradiances and those from the TIMED/SEE and SDO EVE prototype for most lines. This is very encouraging. We have also found good agreement with many previous historical measurements. The general agreement and the small scatter in selected CDS line ratios (those expected to be fairly constant with solar activity) suggest that our long-term corrections are accurate to within 20–30%. We have however highlighted some problems for a few strong lines. Work is in progress to understand the reasons for these discrepancies.
From the analysis of the NIS irradiances, it is clear that lines formed at transition-region temperatures show very little changes over the solar cycle. The reasons for this new result are discussed in Paper III. Lines from He ii and He i are a special case. Lines formed just below 1 MK already show changes over the solar cycle, which increase with the formation temperature of the line. For hotter lines (2.5 MK) the variability reaches factors of the order of 40. These trends are not new but were not quantified before because we never had EUV irradiance measurements spanning a whole solar cycle. The presence of active regions has a strong influence even in regions of the more “quiet corona”, which changes considerably along the cycle, as will be discussed in Paper III.
The largely different behaviour of the EUV line irradiances along the cycle means that it is going to be very difficult to accurately predict solar EUV irradiances based on a proxy. Individual lines, in particular the hotter ones, do show some correlation with the widely-used 10.7 cm radio flux. However, the preliminary comparisons with modelled EUV irradiances shown here do show significant discrepancies.
Future work will focus on improving models of the solar EUV irradiance, with the goal of providing reliable input to climate models and to models of the effects of the magnetic activity of young stars (including the young Sun) on planets, as well as of seeing if the solar results can be extended to other stars. Indeed, even if a proxy or a set of proxies were found to be sufficiently reliable to reproduce the solar irradiance at some EUV wavelength or band, translating such a result to the analysis of the EUV emission of other stars is very dangerous: for example the spot-to-plage ratio likely depends on the stellar activity level.
These types of CDS full-Sun synoptic observations have proved extremely valuable to study the long-term changes of the solar corona. It is strongly recommended that such observations are continued in the future. No other instrument is capable of measuring radiances over the full-Sun in lines spanning the entire temperature range of the solar corona, from the low transition-region to flare temperatures.
ftp://laspftp.colorado.edu/pub/SEE_Data/level2_egs/
ftp://ftp.ngdc.noaa.gov/STP/SOLAR_DATA/SOLAR_RADIO/FLUX
Acknowledgments
G.D.Z. acknowledges support from STFC (UK) through the Advanced Fellowship programme. V.A. acknowledges partial support by the Italian Space Agency (ASI), through ASI-INAF contracts I/035/05/0 and I/05/07/0. CDS was built and operated by a consortium led by the Rutherford Appleton Laboratory (RAL), which includes UCL/Mullard Space Science Laboratory, NASA/ Goddard Space Flight Center, Max Planck Institute for Extraterrestrial Physics, Garching, and Oslo University. SOHO is a mission of international cooperation between ESA and NASA. The results obtained here could not have been achieved without the efforts of the operation and scientific staff, which successfully ran the CDS instrument, in large part at STFC/RAL (UK) and NASA/GSFC (US). We thank the constructive and detailed comments from Tom Woods (LASP), since they helped to improve the manuscript.
References
- Andretta, V., & Jones, H. P. 1997, ApJ, 489, 375 [NASA ADS] [CrossRef] [Google Scholar]
- Andretta, V., Del Zanna, G., & Jordan, S. D. 2003, A&A, 400, 737 [NASA ADS] [CrossRef] [EDP Sciences] [Google Scholar]
- Brekke, P., Thompson, W. T., Woods, T. N., & Eparvier, F. G. 2000, ApJ, 536, 959 [NASA ADS] [CrossRef] [Google Scholar]
- Chamberlin, P. C., Hock, R. A., Crotser, D. A., et al. 2007, in SPIE Conf., 6689 [Google Scholar]
- Chamberlin, P. C., Woods, T. N., Crotser, D. A., et al. 2009, Geophys. Res. Lett., 36, 5102 [NASA ADS] [CrossRef] [Google Scholar]
- Chapman, R. D., & Neupert, W. M. 1974, J. Geophys. Res., 79, 4138 [NASA ADS] [CrossRef] [Google Scholar]
- Dammasch, I. E., Wilhelm, K., Curdt, W., & Schühle, U. 1999, in Magnetic Fields and Solar Processes, ed. A. Wilson et al., ESA SP, 448, 1165 [Google Scholar]
- Del Zanna, G., & Andretta, V. 2006, in SOHO-17. 10 Years of SOHO and Beyond, ESA SP, 617 [Google Scholar]
- Del Zanna, G., & Andretta, V. 2010, IAU Symp. 264, ed. A. G. Kosovichev, A. H. Andrei, & J.-P. Roelot, 78 [Google Scholar]
- Del Zanna, G., Bromage, B. J. I., Landi, E., & Landini, M. 2001, A&A, 379, 708 [NASA ADS] [CrossRef] [EDP Sciences] [Google Scholar]
- Del Zanna, G., Andretta, V., & Beaussier, A. 2005, Mem. Soc. Astron. Ital., 76, 953 [Google Scholar]
- Del Zanna, G., Andretta, V., Chamberlin, P. C., Woods, T. N., & Thompson, W. T. 2010, A&A, 518, A49 [NASA ADS] [CrossRef] [EDP Sciences] [Google Scholar]
- Foukal, P., Bertello, L., Livingston, W. C., et al. 2009, Sol. Phys., 255, 229 [NASA ADS] [CrossRef] [Google Scholar]
- Freeman, F. F., & Jones, B. B. 1970, Sol. Phys., 15, 288 [Google Scholar]
- Haigh, J. D. 1996, Science, 272, 981 [NASA ADS] [CrossRef] [PubMed] [Google Scholar]
- Hall, L. A., & Hinteregger, H. E. 1970, J. Geophys. Res., 75, 6959 [NASA ADS] [CrossRef] [Google Scholar]
- Hall, L. A., Higgins, J. E., Chagnon, C. W., & Hinteregger, H. E. 1969, J. Geophys. Res., 74, 4181 [NASA ADS] [CrossRef] [Google Scholar]
- Harrison, R. A., Sawyer, E. C., Carter, M. K., et al. 1995, Sol. Phys., 162, 233 [NASA ADS] [CrossRef] [Google Scholar]
- Haugan, S. V. H. 1999, Sol. Phys., 185, 275 [Google Scholar]
- Heroux, L., & Higgins, J. E. 1977, J. Geophys. Res., 82, 3307 [NASA ADS] [CrossRef] [Google Scholar]
- Heroux, L., Cohen, M., & Higgins, J. E. 1974, J. Geophys. Res., 79, 5237 [Google Scholar]
- Higgins, J. E. 1976, J. Geophys. Res., 81, 1301 [NASA ADS] [CrossRef] [Google Scholar]
- Hinteregger, H. E., Fukui, K., & Gilson, B. R. 1981, Geophys. Res. Lett., 8, 1147 [Google Scholar]
- Hock, R. A., Chamberlin, P. C., Woods, T. N., et al. 2010, Sol. Phys., 37 [Google Scholar]
- Hovestadt, D., Hilchenbach, M., Bürgi, A., et al. 1995, Sol. Phys., 162, 441 [NASA ADS] [CrossRef] [Google Scholar]
- Jordan, S. D., & Brosius, J. W. 2007, in The Physics of Chromospheric Plasmas, ed. P. Heinzel, I. Dorotovič, & R. J. Rutten, ASP Conf. Ser., 368, 183 [Google Scholar]
- Kuin, N. P. M., & Del Zanna, G. 2007, Sol. Phys., 242, 187 [NASA ADS] [CrossRef] [Google Scholar]
- Lean, J., Beer, J., & Bradley, R. 1995, Geophys. Res. Lett., 22, 3195 [NASA ADS] [CrossRef] [Google Scholar]
- Malinovsky, L., & Heroux, M. 1973, ApJ, 181, 1009 [NASA ADS] [CrossRef] [Google Scholar]
- Meehl, G. A., Arblaster, J. M., Matthes, K., Sassi, F., & van Loon, H. 2009, Science, 325, 1114 [NASA ADS] [CrossRef] [PubMed] [Google Scholar]
- Orlando, S., Peres, G., & Reale, F. 2004, A&A, 424, 677 [NASA ADS] [CrossRef] [EDP Sciences] [Google Scholar]
- Priest, E., Lockwood, M., Solanki, S., Wolfendale, A., & Coustenis, A. 2007, Astron. Geophys., 48, 030000 [NASA ADS] [CrossRef] [Google Scholar]
- Richards, P. G., Woods, T. N., & Peterson, W. K. 2006, Adv. Space Res., 37, 315 [Google Scholar]
- Thomas, R. J. 2002, The Radiometric Calibration of SOHO, ESA SR-002, ed. A. Pauluhn, M. C. E. Huber, & R. von Steiger, 2, 225 [Google Scholar]
- Thompson, W. T. 1999, SOHO CDS software note, 53 [Google Scholar]
- Thompson, W. T., & Brekke, P. 2000, Sol. Phys., 195, 45 [Google Scholar]
- Timothy, A. F., & Timothy, J. G. 1970, J. Geophys. Res., 75, 6950 [NASA ADS] [CrossRef] [Google Scholar]
- Timothy, J. G. 1977, in The Solar Output and its Variation, ed. O. R. White, 237 [Google Scholar]
- Tobiska, W. K., Bouwer, S. D., & Bowman, B. R. 2008, J. Atm. Solar-Terrestrial Phys., 70, 803 [Google Scholar]
- Vernazza, J. E., & Reeves, E. M. 1978, ApJS, 37, 485 [NASA ADS] [CrossRef] [Google Scholar]
- Wilhelm, K., Curdt, W., Marsch, E., et al. 1995, Sol. Phys., 162, 189 [NASA ADS] [CrossRef] [Google Scholar]
- Wilhelm, K., Lemaire, P., Dammasch, I. E., et al. 1998, A&A, 334, 685 [NASA ADS] [Google Scholar]
- Woods, T. N., Rottman, G. J., Bailey, S. M., Solomon, S. C., & Worden, J. R. 1998, Sol. Phys., 177, 133 [NASA ADS] [CrossRef] [Google Scholar]
- Woods, T. N., Tobiska, W. K., Rottman, G. J., & Worden, J. R. 2000, J. Geophys. Res., 105, 27195 [NASA ADS] [CrossRef] [Google Scholar]
- Woods, T. N., Eparvier, F. G., Bailey, S. M., et al. 2005a, J. Geophys. Res. (Space Physics), 110, 1312 [NASA ADS] [CrossRef] [Google Scholar]
- Woods, T. N., Eparvier, F. G., Bailey, S. M., et al. 2005b, J. Geophys. Res. (Space Physics), 110, 1312 [NASA ADS] [CrossRef] [Google Scholar]
- Woods, T. N., Lean, J. L., & Eparvier, F. G. 2006, in Proceedings of the ILWS Workshop, ed. N. Gopalswamy, & A. Bhattacharyya, 145 [Google Scholar]
- Woods, T. N., Chamberlin, P. C., Peterson, W. K., et al. 2008, Sol. Phys., 250, 235 [NASA ADS] [CrossRef] [Google Scholar]
- Woods, T. N., Chamberlin, P. C., Harder, J. W., et al. 2009, Geophys. Res. Lett., 36, 1101 [Google Scholar]
All Tables
All Figures
|
Fig. 1 CDS (negative) radiances from (top to bottom) He i, O v (~0.25 MK), Mg x (~1 MK), Fe xvi (~2.5 MK), from the beginning of cycle 23, to the current extended minimum. Images are on linear intensity scales. The radiances of each line are displayed with the same scale for the entire period. |
| In the text | |
|
Fig. 2 The estimation of the off-limb contribution to the total irradiance for a selection of lines: the “chromospheric” He i 584 Å, the transition-region (~0.25 MK) O v 630 Å, the “coronal” (~1 MK) Mg x 625 Å, and the “hot” (~2.5 MK) Fe xvi 361 Å, in addition to the two second-order lines Si xi 303 Å and He ii 304 Å. Images are negative. The solar images and the histograms are displayed in logarithmic scales. |
| In the text | |
|
Fig. 3 CDS irradiances (boxes) for chromospheric and lower-transition region lines at 1 AU (108 phot cm-2 s-1). The CDS irradiances are compared with the CDS/ rocket EGS measurements of May 1997 by Brekke et al. (2000) [asterisks], the TIMED SEE EGS [triangles] and the SDO/EVE prototype spectrum of 2008 April 14 [diamond]. |
| In the text | |
|
Fig. 4 CDS irradiances (boxes, 108 phot cm-2 s-1) for upper-transition region lines. The CDS irradiances are compared with other datasets as in Fig. 3. |
| In the text | |
|
Fig. 5 CDS irradiances (boxes, 108 phot cm-2 s-1) for higher-temperature lines. The CDS irradiances are compared with other datasets as in Fig. 3. |
| In the text | |
|
Fig. 6 Ratios (photon units) of SOHO/NIS EUV irradiances in lines from He and other ions which should be approximately constant with the solar cycle. The dashed lines correspond to the values from the averaged Skylab ATM radiances in the quiet Sun, while the diamond refer to the SDO/EVE prototype spectrum of 2008 April 14. The full line indicates the irradiance ratios from the Heroux et al. (1974) measurements. |
| In the text | |
|
Fig. 7 CDS irradiances (108 phot cm-2 s-1), compared with modelled ones. HEUVAC: Richards et al. (2006); SIP: Tobiska et al. (2008); H81: Hinteregger et al. (1981). |
| In the text | |
|
Fig. 8 Correlation between SOHO/CDS irradiances (F) and daily 10.7 cm radio fluxes (10-22 W m-2 Hz-1). |
| In the text | |
|
Fig. 9 Ratios (photon units) of SOHO/NIS EUV irradiances in a selection of lines. |
| In the text | |
Current usage metrics show cumulative count of Article Views (full-text article views including HTML views, PDF and ePub downloads, according to the available data) and Abstracts Views on Vision4Press platform.
Data correspond to usage on the plateform after 2015. The current usage metrics is available 48-96 hours after online publication and is updated daily on week days.
Initial download of the metrics may take a while.